1. Once a chart has been opened left click the Edit Chart button, which is located at the top of a chart. If a chart window has multiple tabs, first left click the corresponding chart tab you would like to customize and change the chart style for.
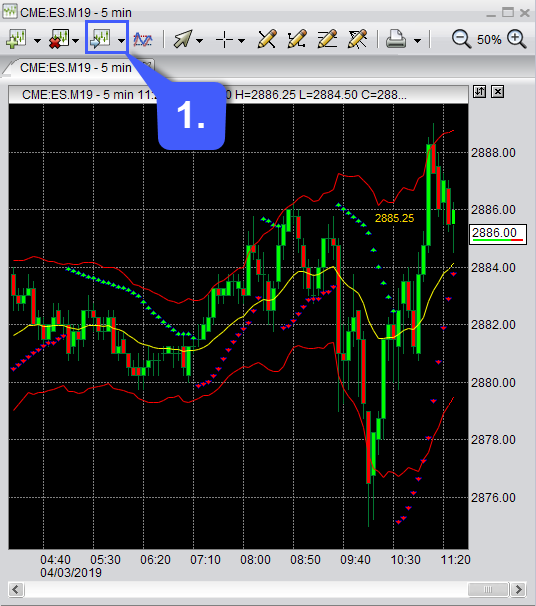
After the Edit Chart button has been clicked, it will open the “Modify Indicator” window. This grants traders with the ability to modify any indicators they have applied to the chart as well as changing the chart style and customizing chart colors.
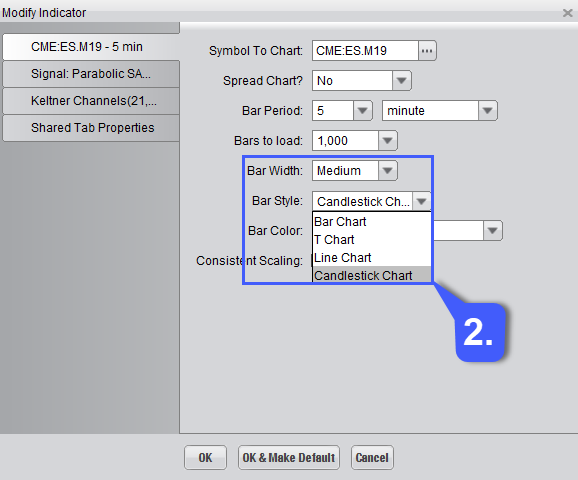
2. To change the style of a chart, left click the dropdown menu associated with the Bar Style field. Users have the option of selecting from a bar chart, T Chart, Line Chart, and Candlestick Chart. Users can also change the color of their chart style by selecting a color from the Bar Color field or the width of it’s lines by selecting a width size in the Bar Width field.
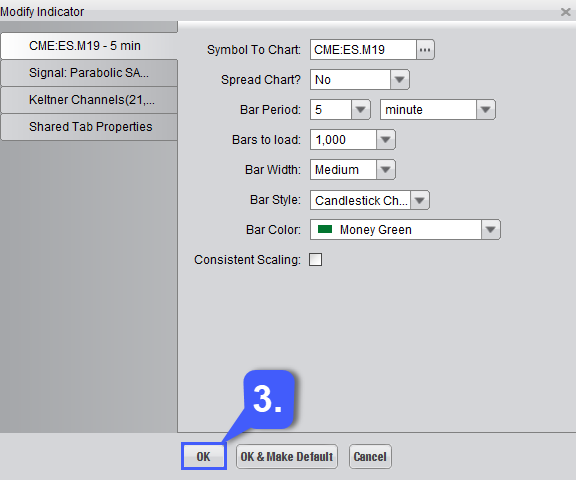
3. Once the user has changed the style of their chart and customized it to their liking, they can apply changes by left clicking the OK button at the bottom of the window. If users want these changes to be applied to any chart opened in the future, they can also choose the OK & Make Default option.