To select a specific chart type or to change the type of chart once it has been opened, users will first need to begin the process of opening a chart.
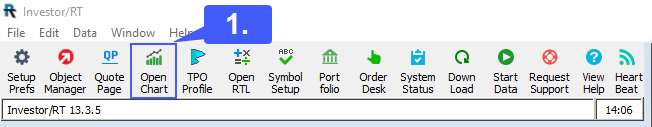
1. Navigate to the top left of the platform window. On the toolbar left click the Open Chart button.
2. In the Object Manager window, under the Charts section, are various chart types to select from. Users can first select between a standard chart, Multi-Pane chart, and a TPO Profile chart. From there, the options extend further as shown in the example below.
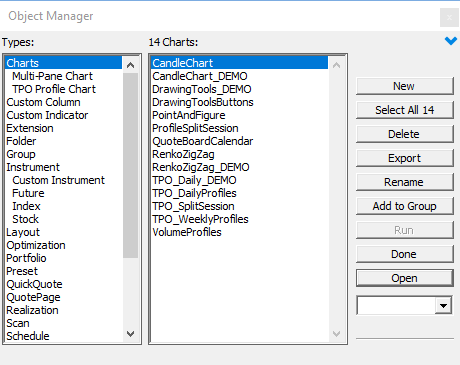
3. Once a chart type and style have been selected, left click the New button.
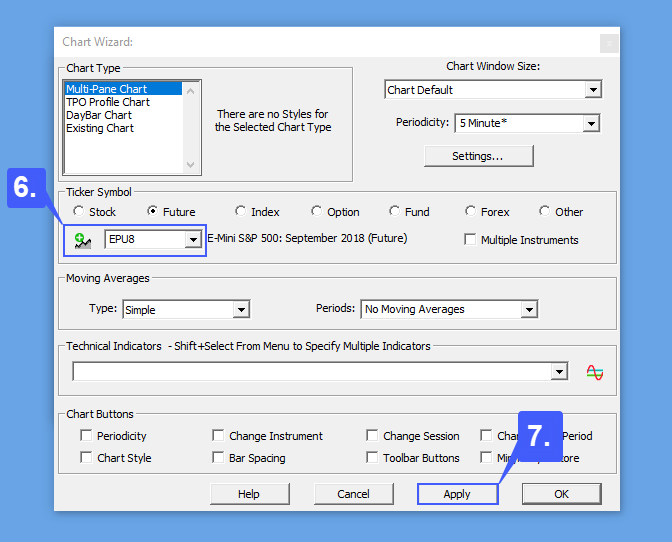
4. If needed, users can once again alter the chart type by navigating to the Chart Type section located in the top left of the Chart Wizard and by left clicking the chart type they wish to change their current chart to.
5. Adjust the settings in the Chart Wizard window to your liking. Users can specify the chart window size, time interval, ticker symbol, contract, moving averages, technical indicators, and many more options.
6. Manually enter the contract symbol in the dropdown box or left click the green + button to search for a contract to apply to the chart.
7. Once all settings have been entered and selected appropriately, left click the Apply button to apply the settings and open the chart.
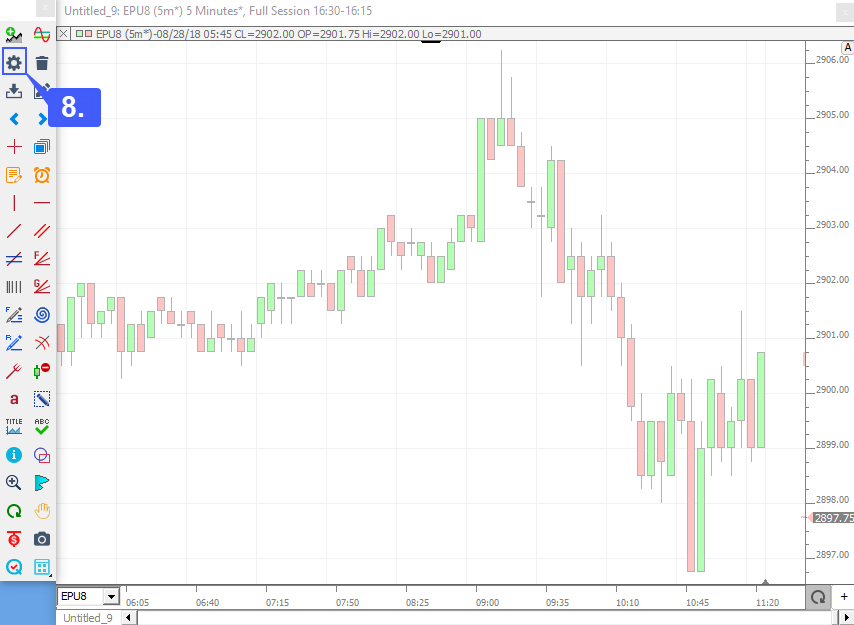
8. Once a chart is open users can navigate to the chart toolbar and left click the preferences button.
9. Under the Preferences window, users can once again change the style of their chart by left clicking the Style dropdown button.
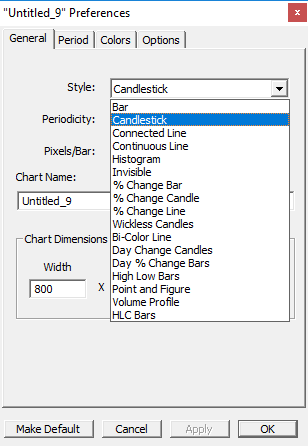
10. Once a chart style has been selected, left click the apply button and then Ok.
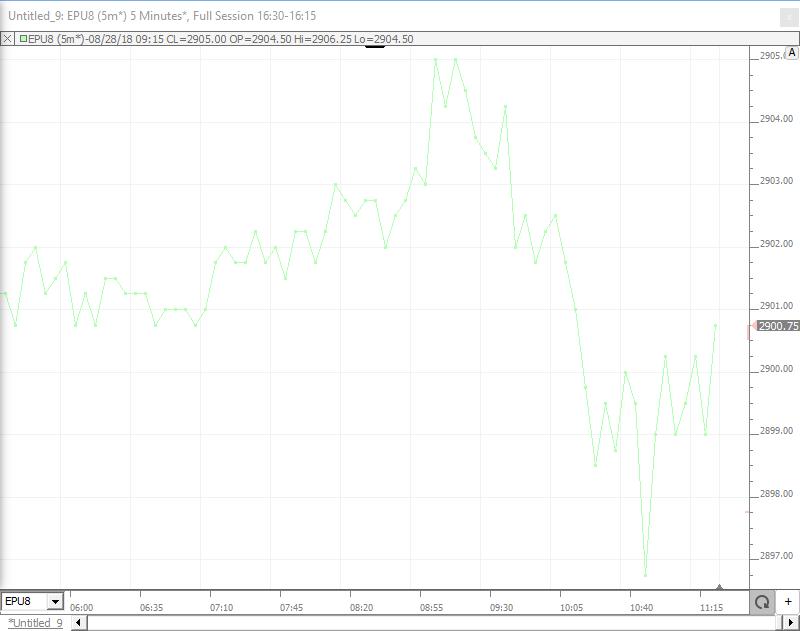
In our example below we have selected the Connected Line style.