Users will first need to open a chart to select a new time interval for their chart.
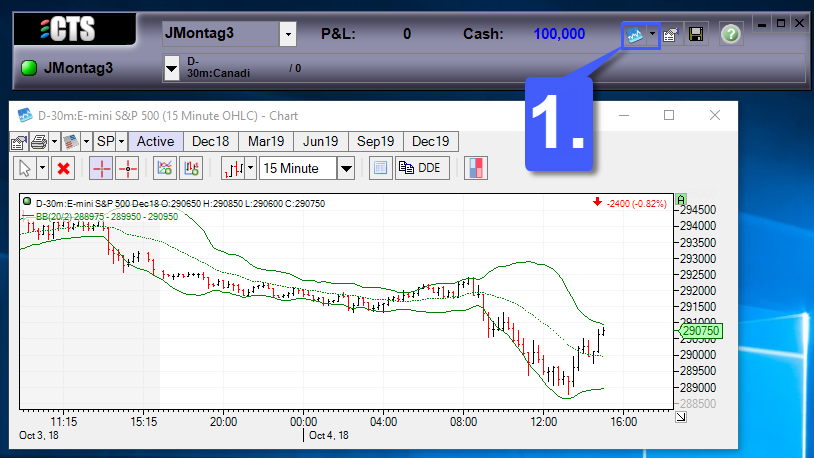
1. Navigate to the CTS toolbar that is positioned above the rest of the platform windows and left click the New Item Menu to open the dropdown box to select the widget you would like to open.
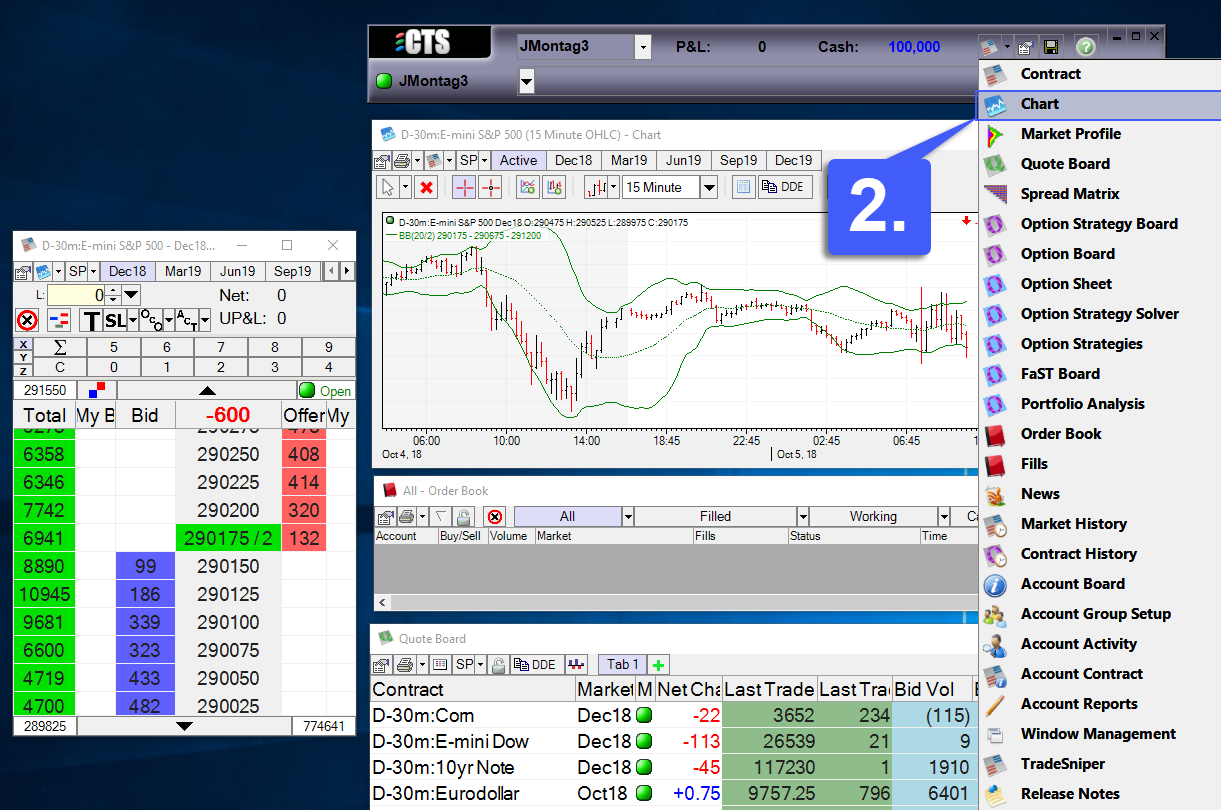
2. Select the Chart option.
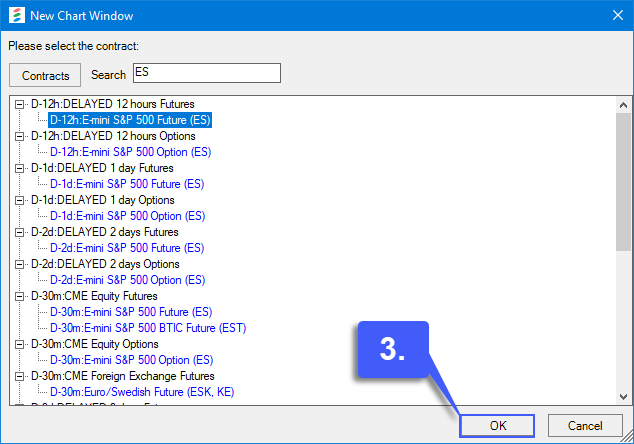
3. Once selected, the user has the option of manually entering the contract they would like to trade or by searching through the CTS database. Once a contract has been chosen, highlight it and then left click the OK button.
4. Upon clicking the OK button, the chart with the specified contract will open
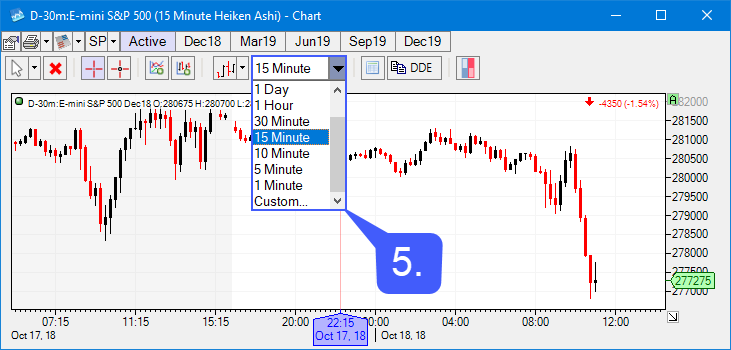
5. Users can now select a time interval for their chart by left clicking the dropdown menu which is highlighted below. If users need to select an interval that is not displayed in the default dropdown menu, select the Custom… option.
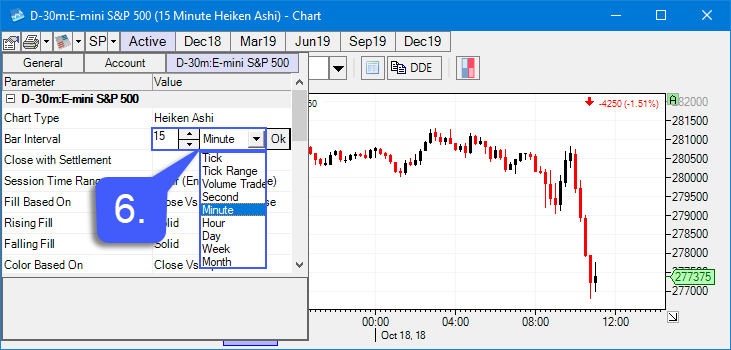
6. In the custom time interval menu, left click within the Value field in the Bar Interval row. This will allow users to select from a time interval of their choice. Users can display their time interval by ticks, volume, seconds, minutes, hours, days, weeks, and months.
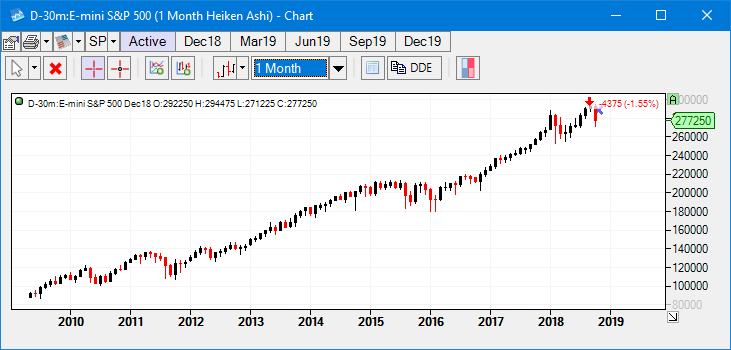
In the example below we have selected a 1 Month time interval for our chart.