Upon opening a chart on CQG Desktop users are presented with various types of charts they can open.
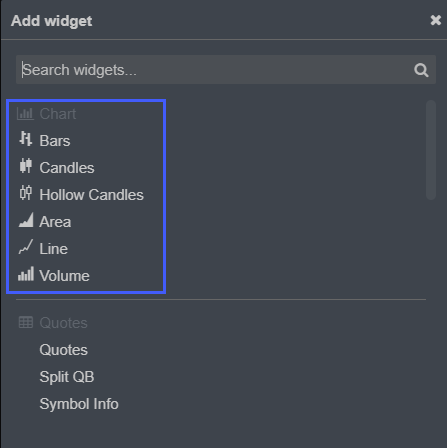
Users can also change the chart type for a chart they have already added to their workspace.
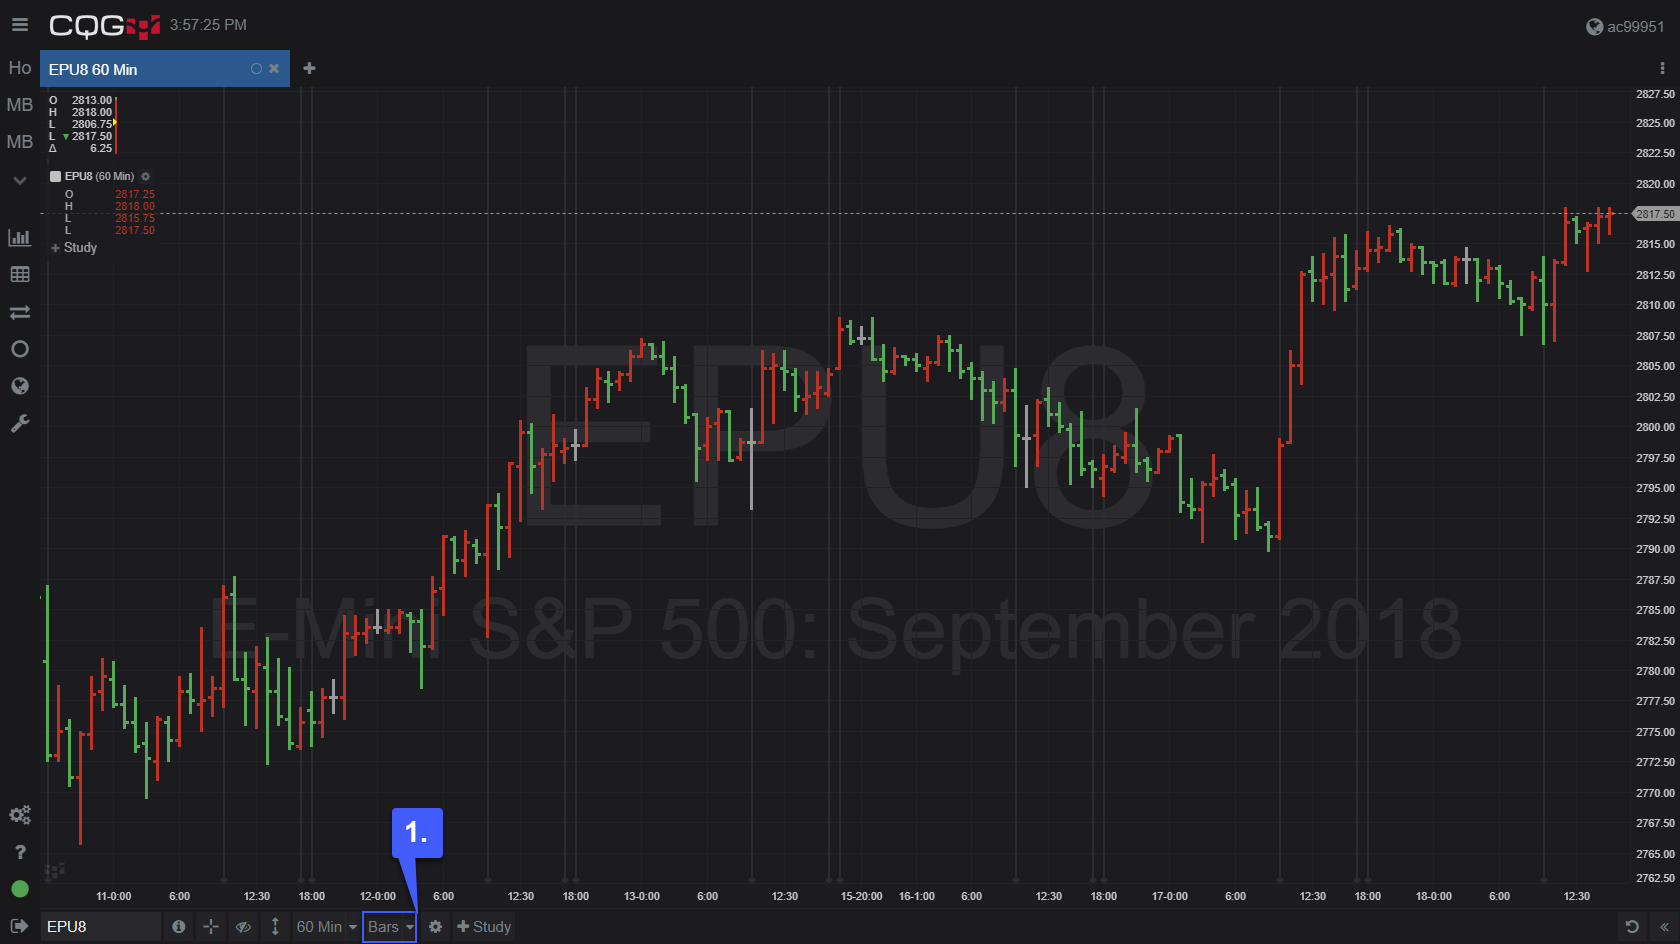
1. Once a chart has been opened, navigate to the bottom of the workspace. Located between the time interval option and chart settings is the option to change chart types.
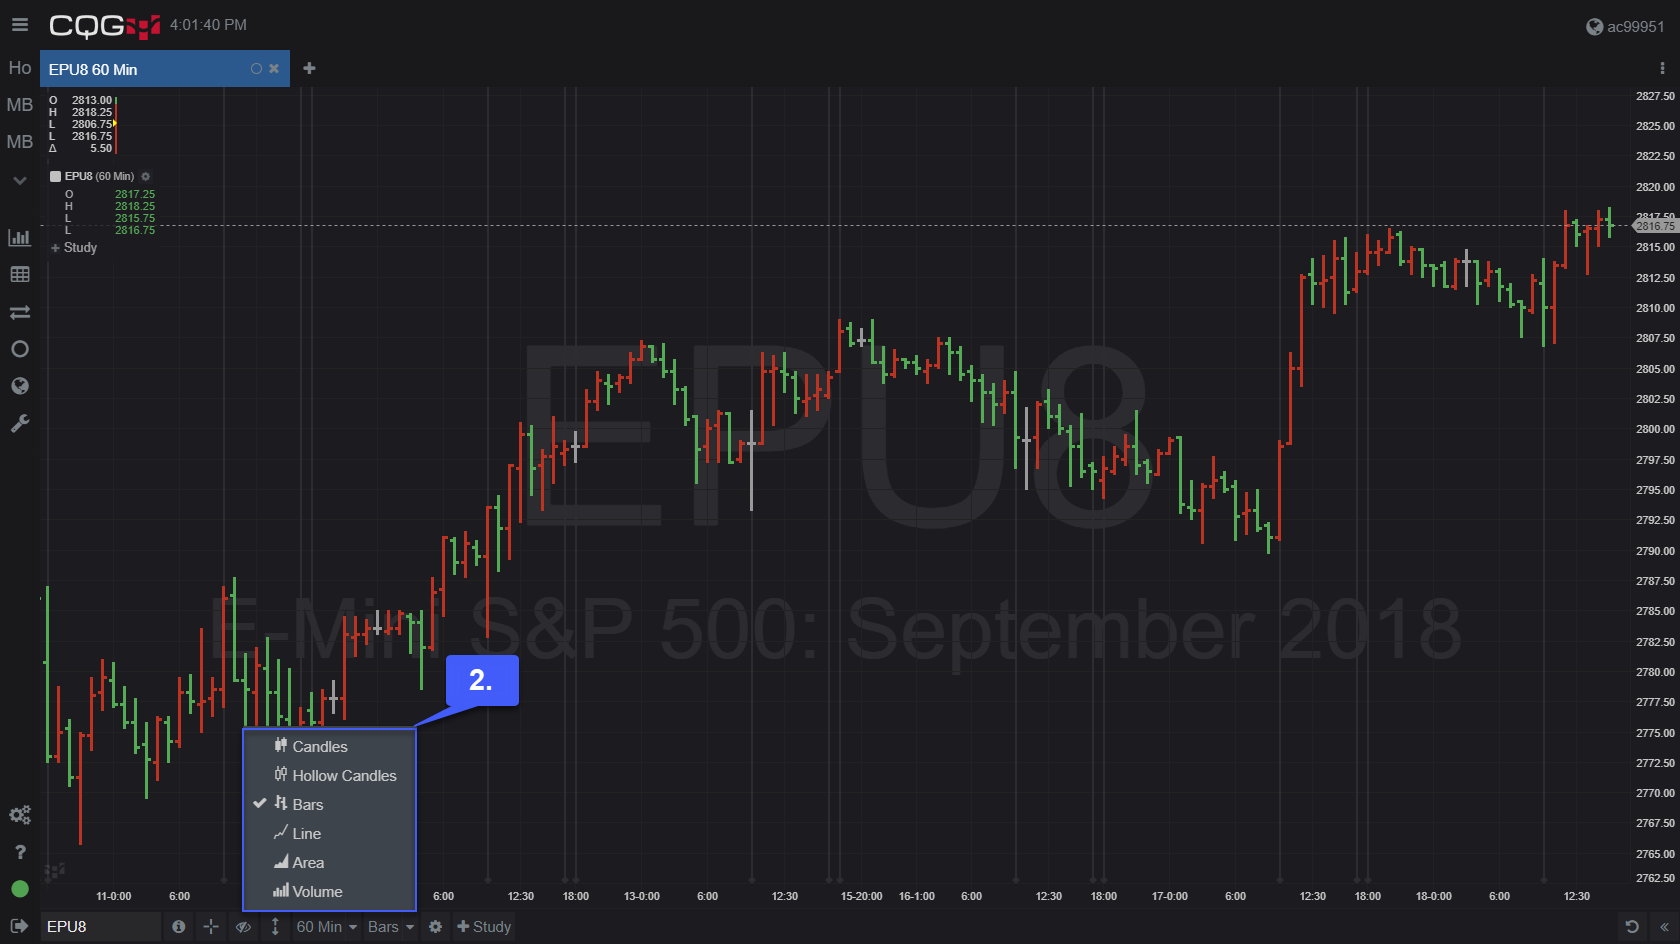
2. After the user selects this option they will be able to alter the chart type of the chart they have previously added to their workspace.
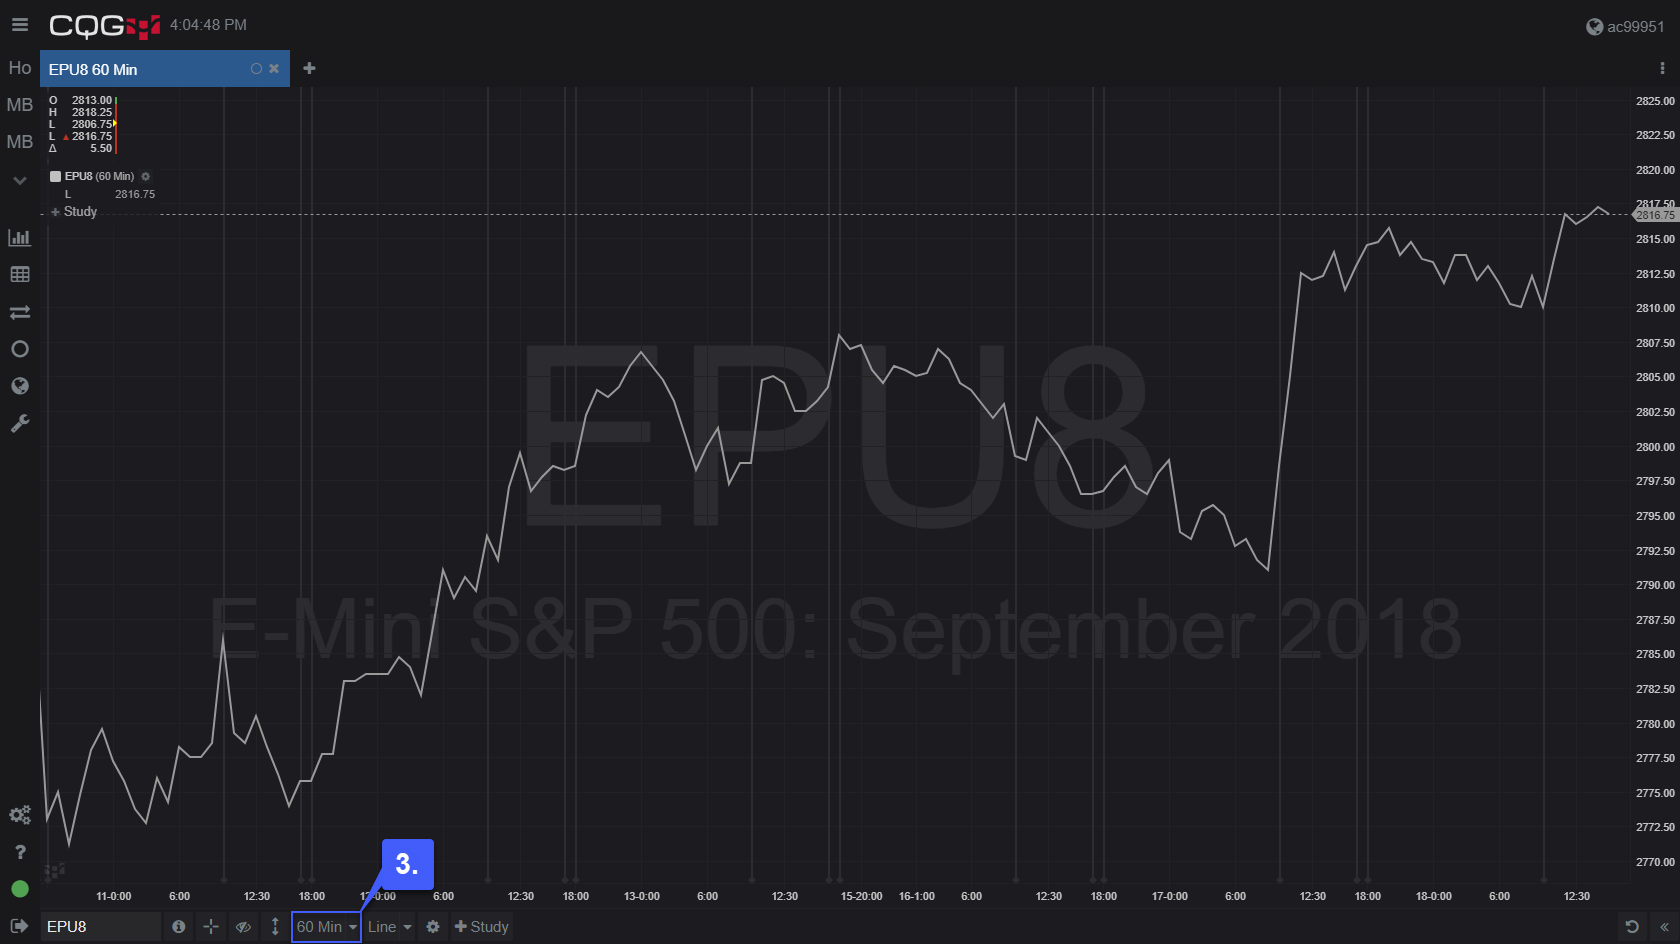
3. In the example below, we have changed our bar chart to a line chart. The chart type setting always displays the chart type currently active.