Users will first need to open a chart to select the chart type they would like displayed.
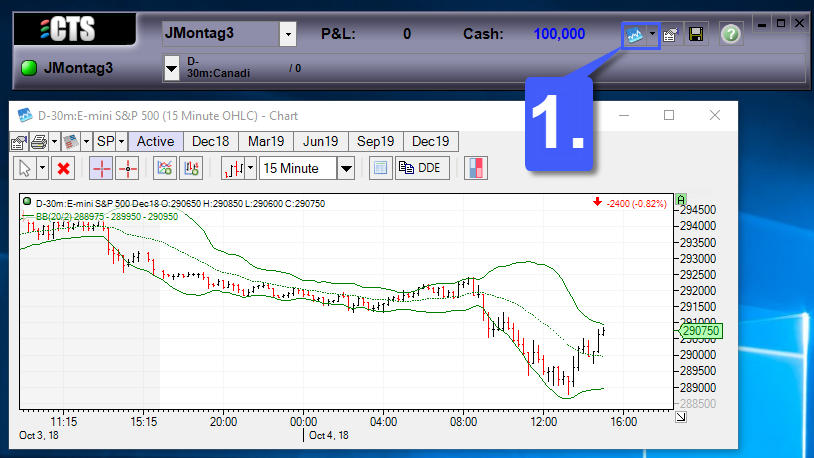
1. Navigate to the CTS toolbar that is positioned above the rest of the platform windows and left click the New Item Menu to open the dropdown box to select the widget you would like to open.
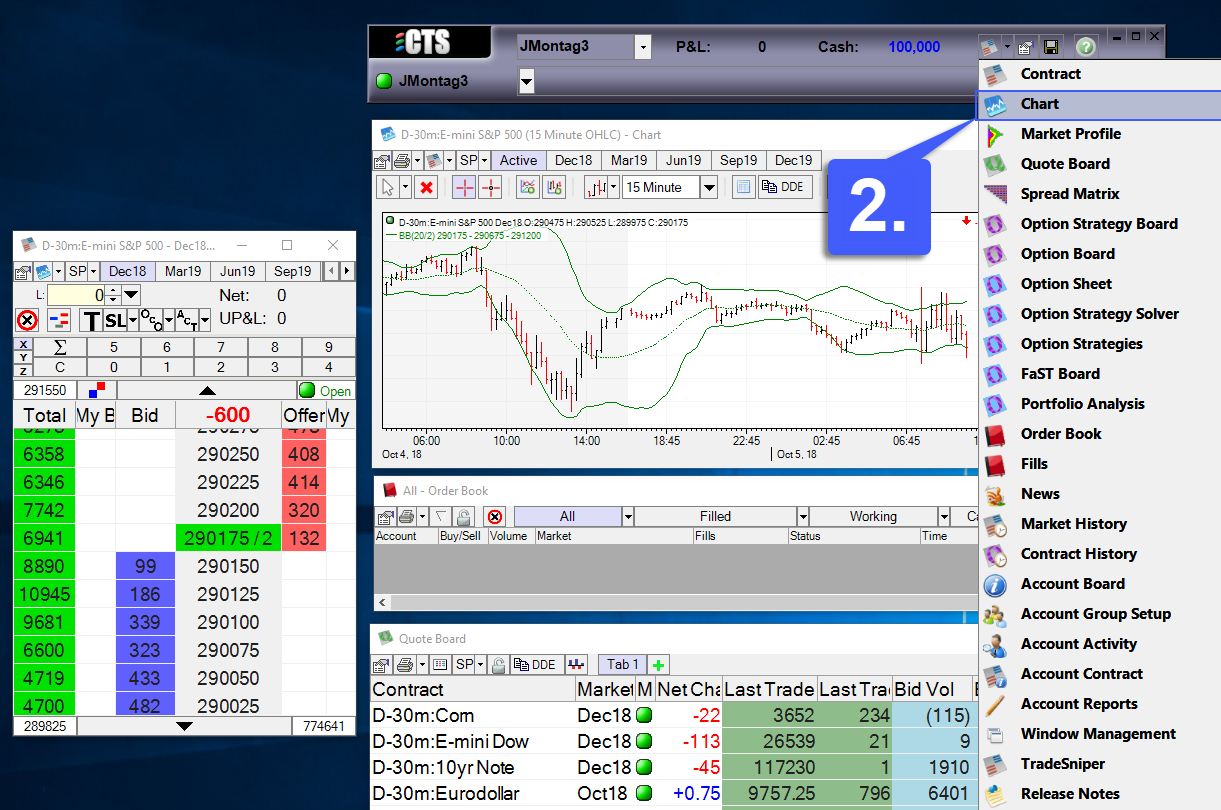
2. Select the Chart option.
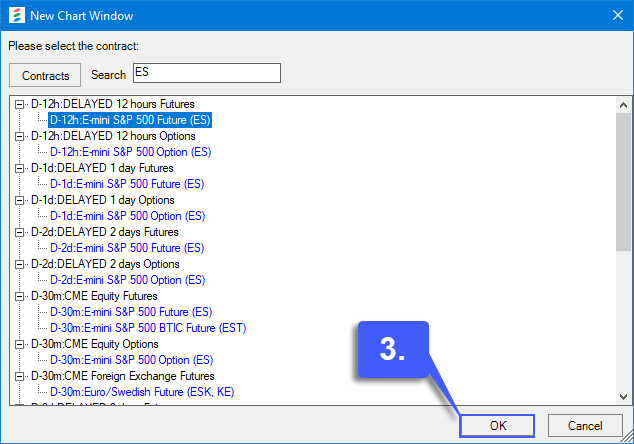
3. Once selected, the user has the option of manually entering the contract they would like to trade or by searching through the CTS database. Once a contract has been chosen, highlight it and then left click the OK button.
4. Upon selecting the OK button, the chart with the specified contract will open.
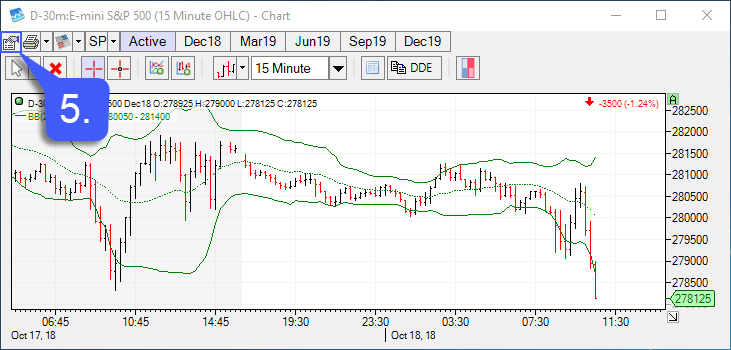
5. Left click the Properties icon located in the top left corner of the chart window.
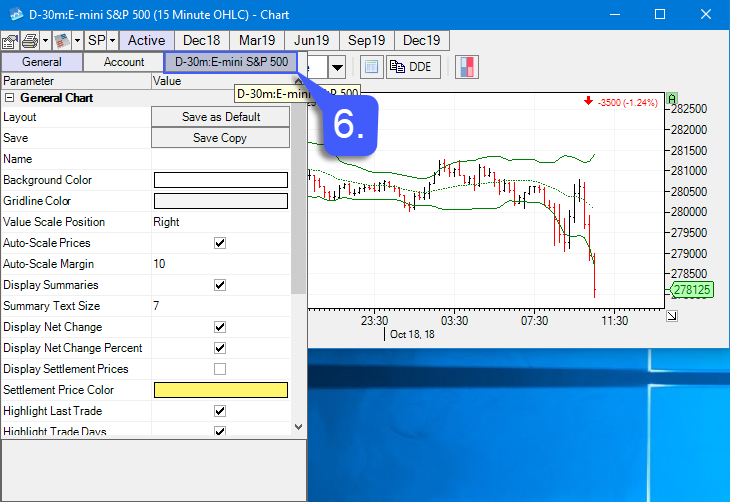
6. Left click the tab in the Properties menu with the name of the contract that has been applied to your chart. In our example, this is the tab with the title: D-30m: E-mini S&P 500.
7. Once selected, left click the Value field located in the Chart Type row. This will allow users to select the chart type of their choice.
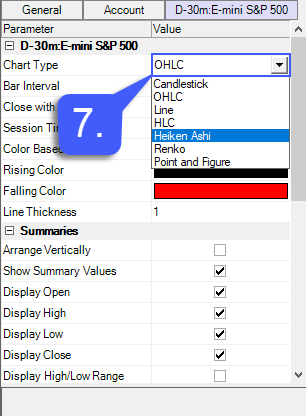
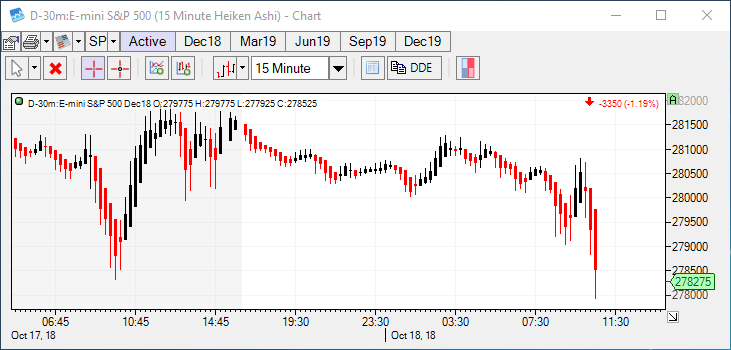
After a chart type is chosen, the specified chart will automatically configure to the new chart type that was selected. In our example, we have selected the Heiken Ashi chart style as shown below.