First Open A Chart:
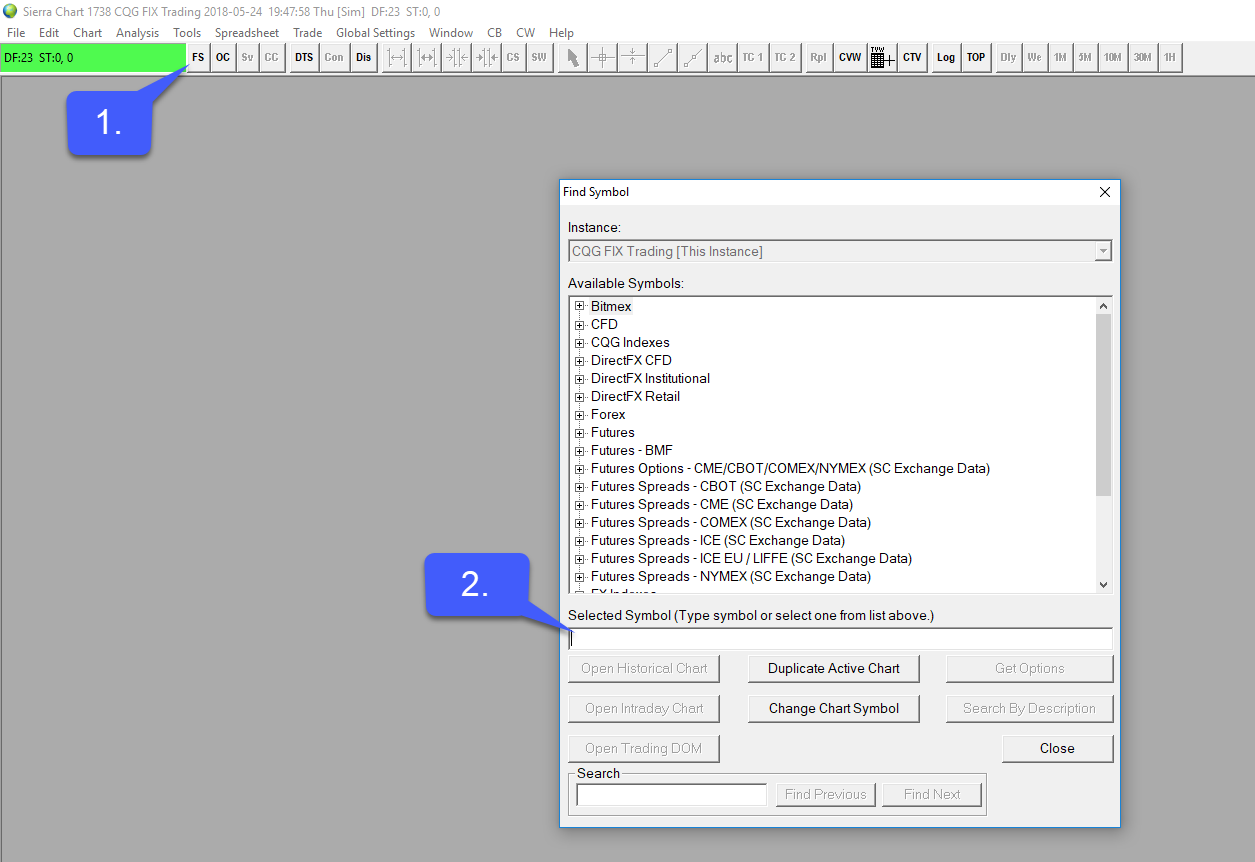
1. Navigate to the FS (Find Symbol) button in the upper left hand corner of the platform window
2. Scroll through the available symbols or search for the specific contract that you would like to open a chart for.
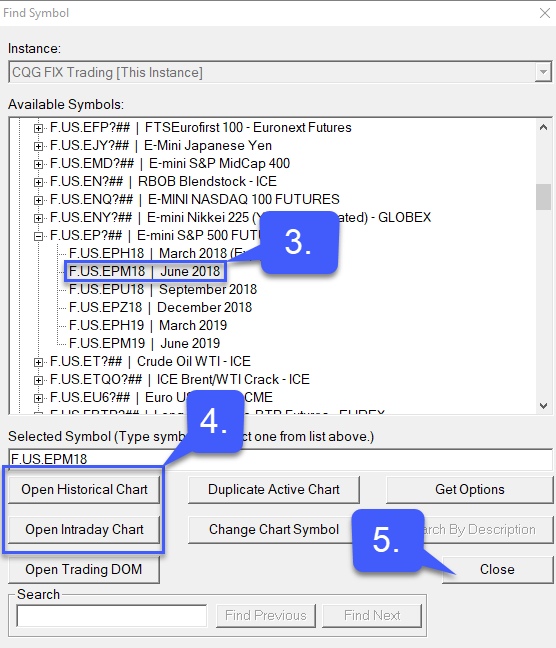
3. Highlight the specific contract you wish to trade with
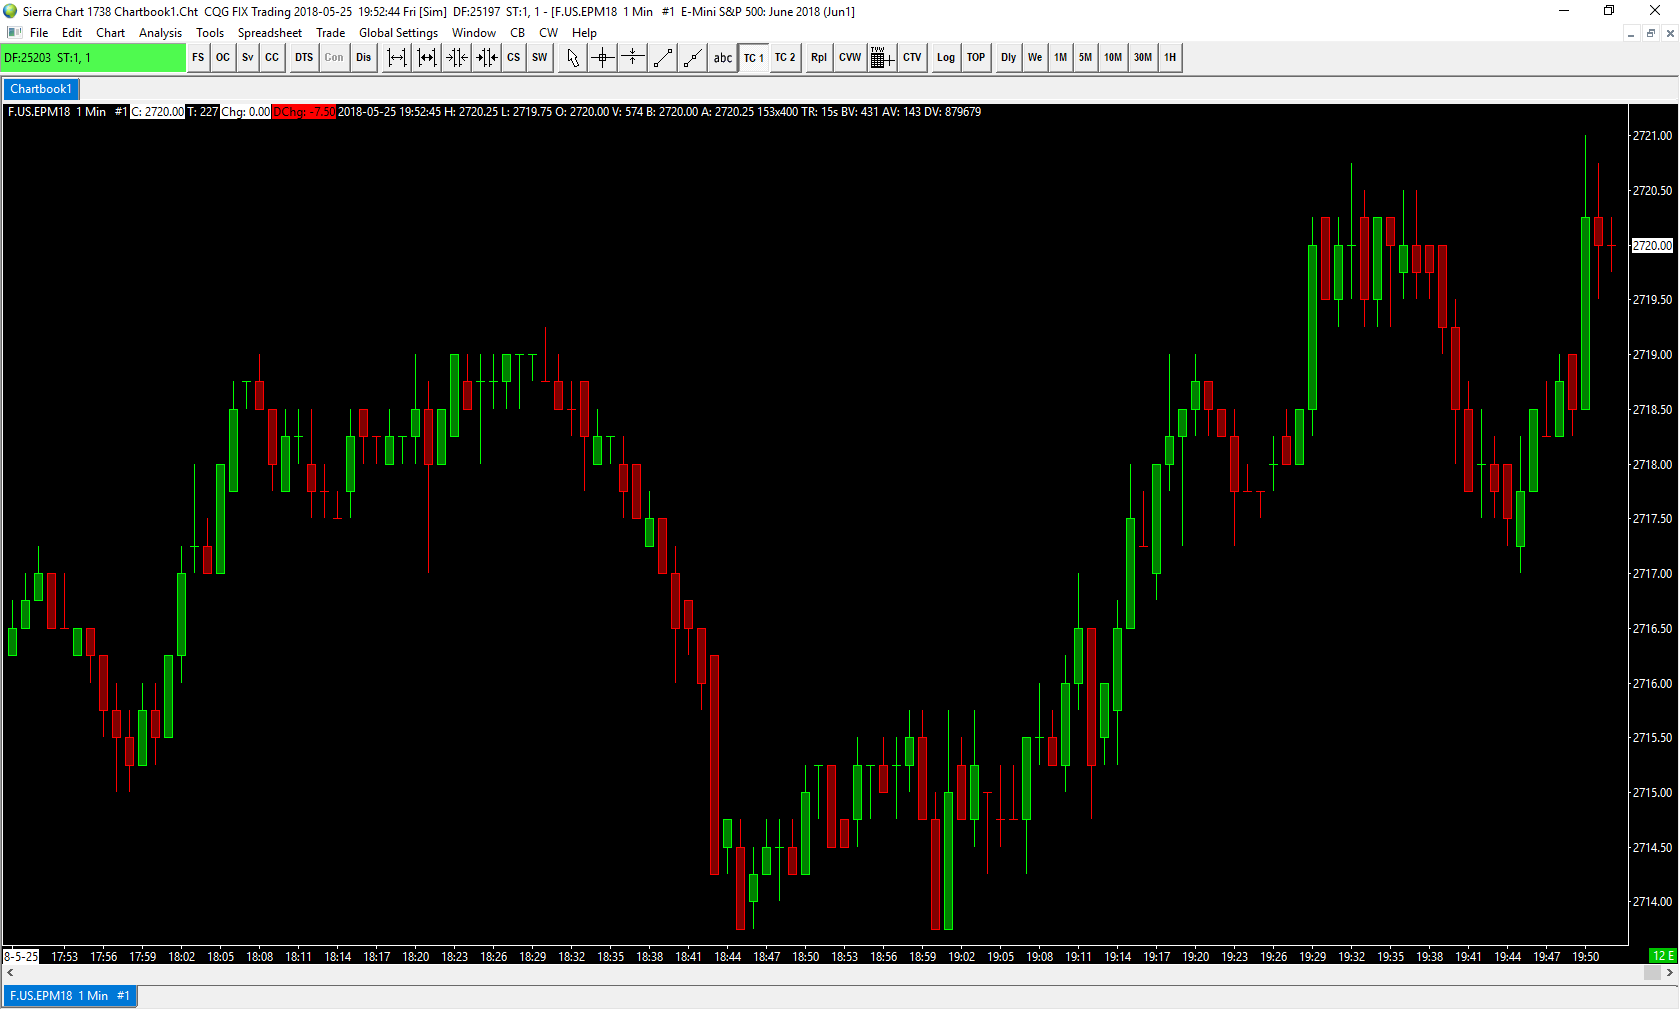
4. Select either a historical or intraday chart.
5. After selecting your preferred type of chart, close out the find symbol window to gain access to your chart.
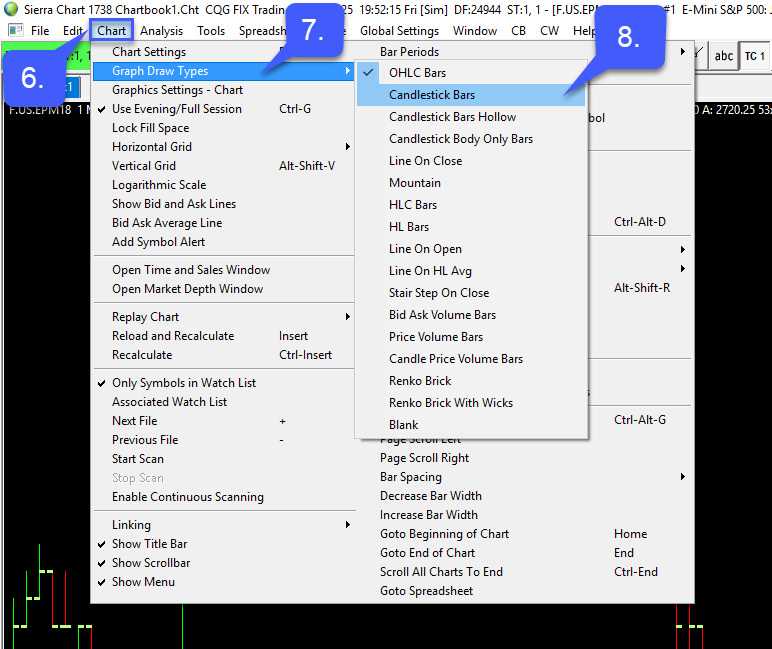
6. Once a chart is open, navigate to the Chart tab on the top of the platform window.
7. Scroll over Graph Draw Types.
8. Once Graph Draw Types is highlighted users can move to the new drop down menu that appears to the right and select the draw type, such as candlestick bars of their corresponding graph.