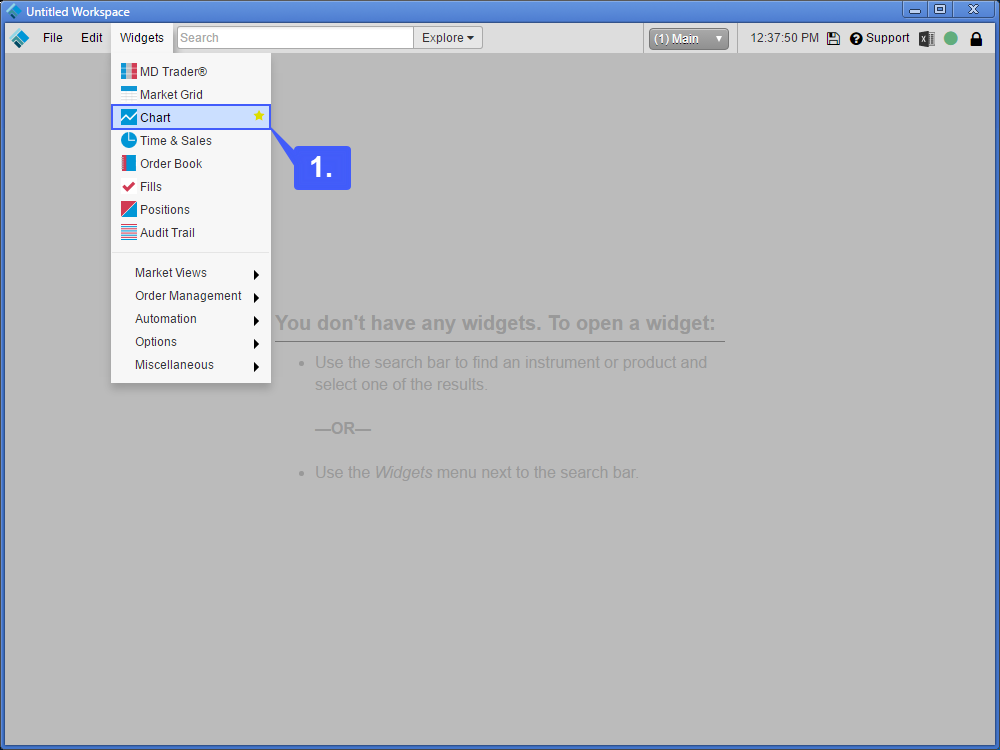
1. Navigate to the top left of the platform window, left click the Widgets tab and then select Chart.
Once the chart widget has been opened users can immediately select the chart type they would like to apply to the chart widget.
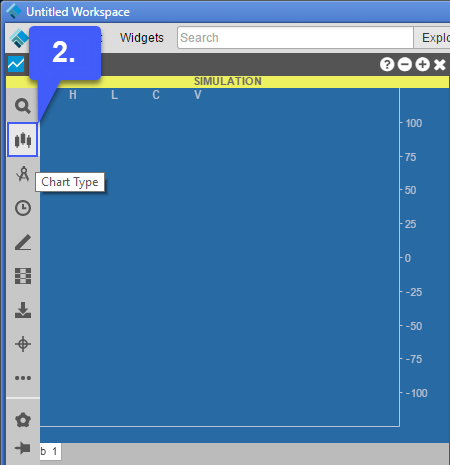
2. Left click the three horizontal lines and then select the Chart Type button.
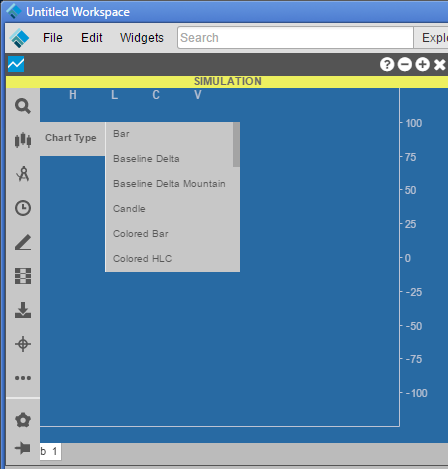
3. There are various chart types in which a user can select for their chart. Once a chart type has been selected, users can proceed through the same steps that they would normally take to open a chart.
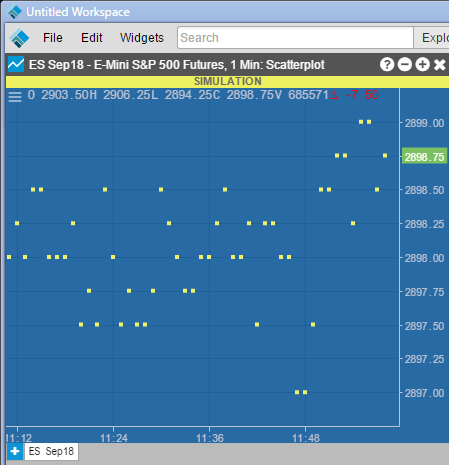
In our example below we have open a chart widget with a Scatterplot chart type applied to the graph of the E-Mini S&P 500 of September 2018.
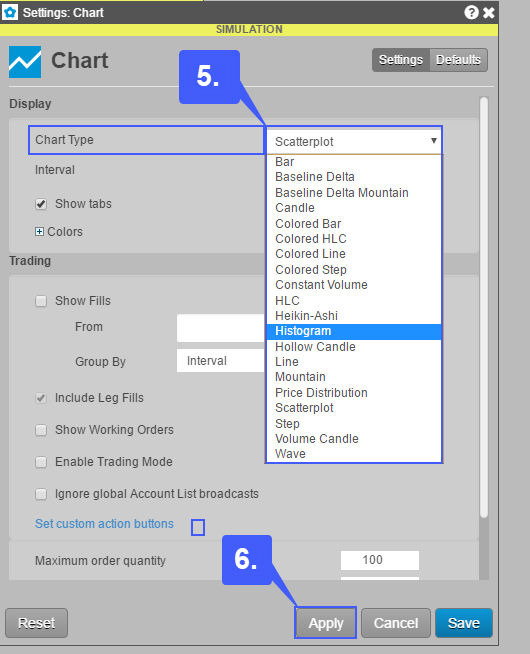
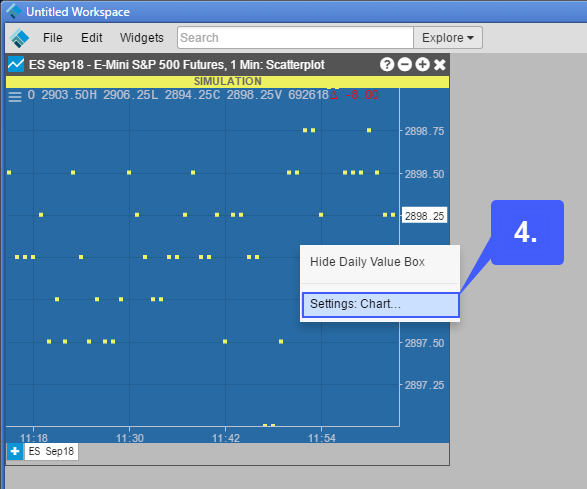
4. Users can also change their chart type by right clicking on an opened chart. Once the user has right clicked, select the Setings: Chart… option.
5. In the settings menu, select the Chart Type drop down menu to access the various chart types offered by TT.
6. Once selected, left click the apply button and the chart widget will automatically apply your selected choice.