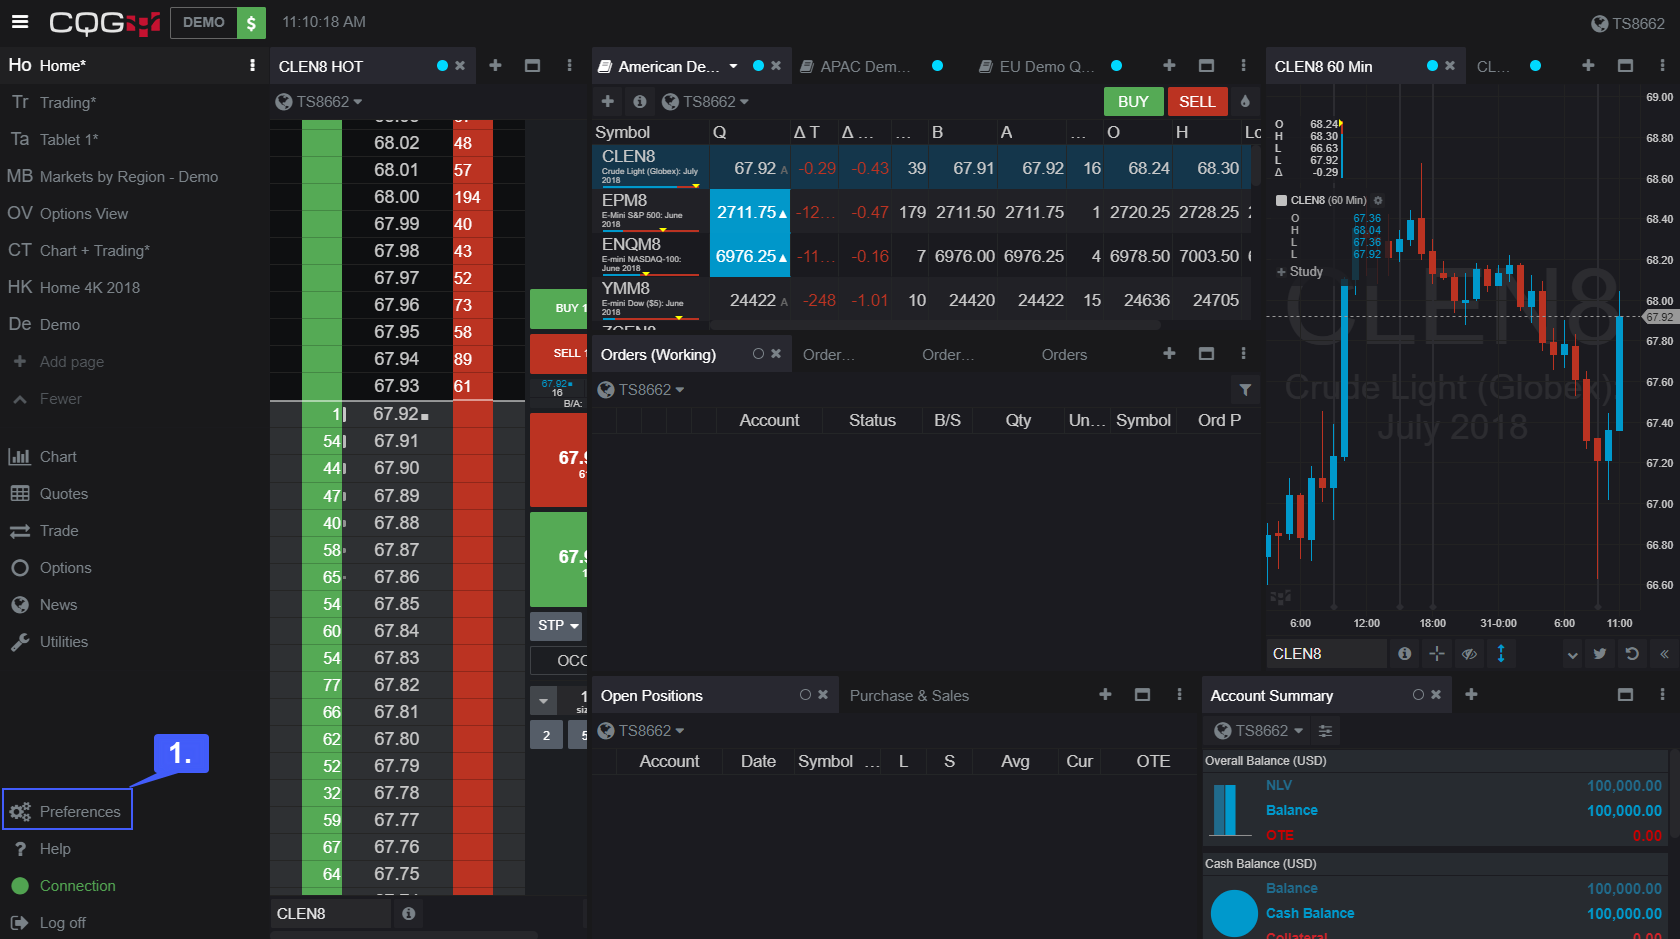
1. Navigate to the bottom left of the platform window and left click on the Preferences tab.
2. Left click the Buy/sell colors or Price movement colors options.

The green/red color scheme is the default option for buy/sell colors. To change this simply left click the color scheme of your liking. For example, for the Blue/Red buy/sell colors option, the blue color is represents buy and red represents sell.
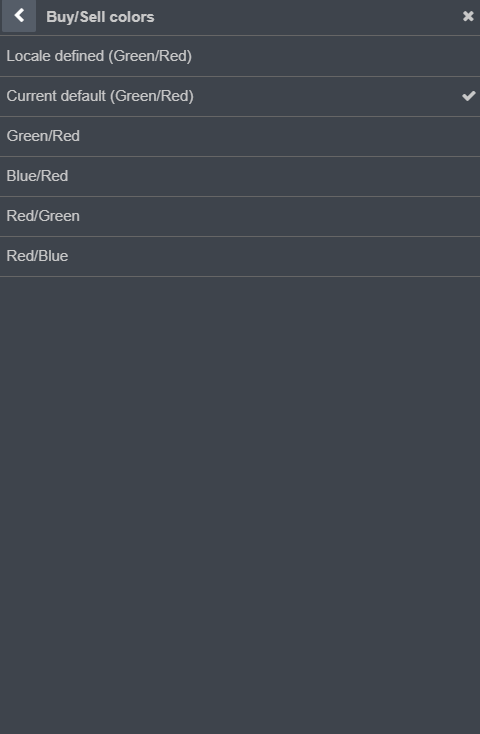
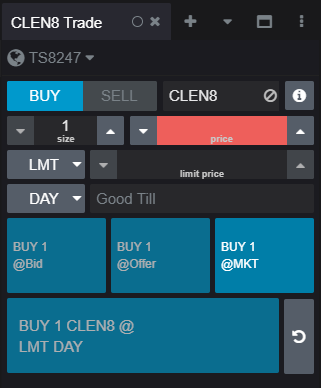
If you select the Blue/Red option, any button on the platform related to buying is changed to blue, anything related to selling is changed to red.
To change Price movement colors follow the same process as listed above, but select the Price movement colors option. The blue/red color scheme is set by default. Blue representing increases in price while red representing decreases.
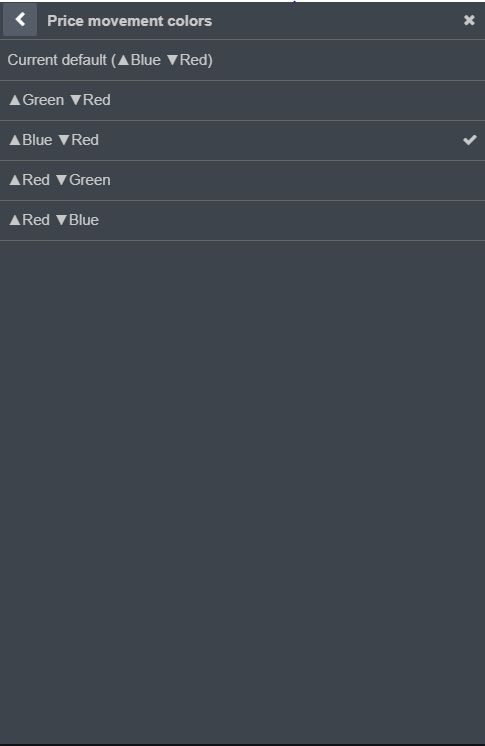
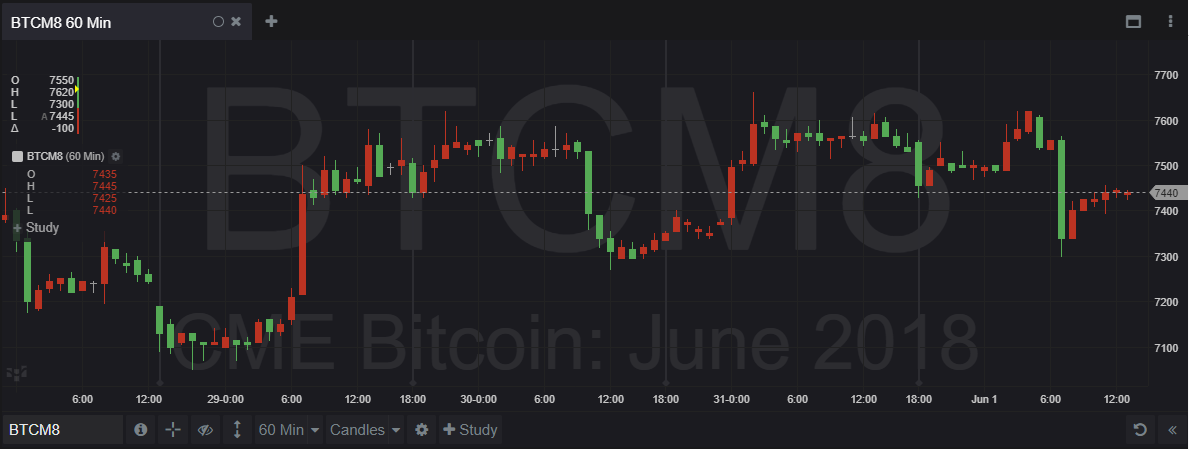
If the Red / Green option is selected any positive price change will be reflected by a red color and any negative price change will be represented by a green color. The following candlestick chart illustrates the changes made.