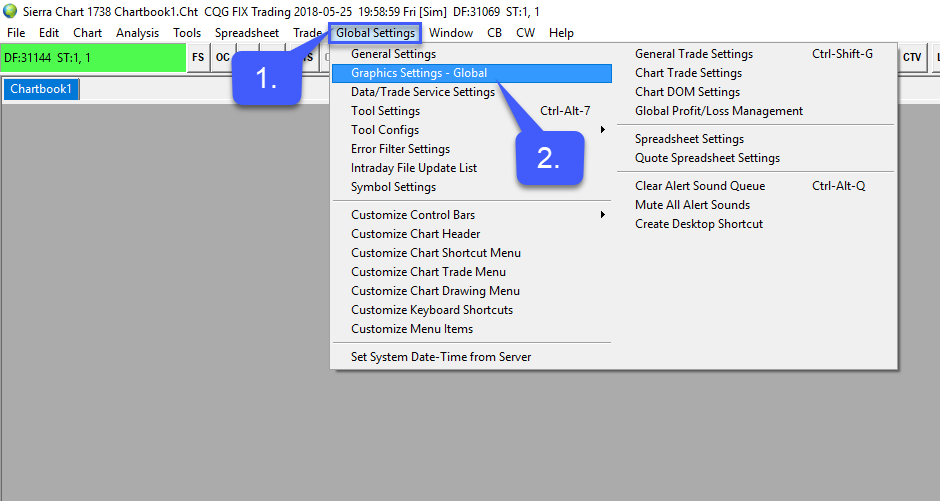
1. Navigate to the Global Settings tab in the upper portion of the platform window.
2. Navigate to the Graphics Settings – Global tab.
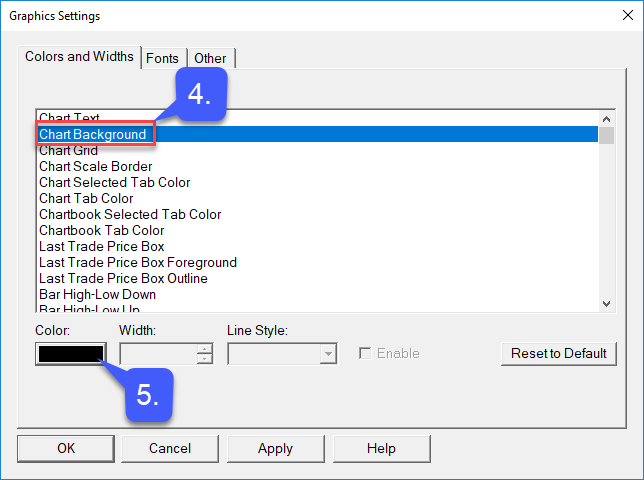
3. Highlight the Chart Background option.
4. Left click the Color box
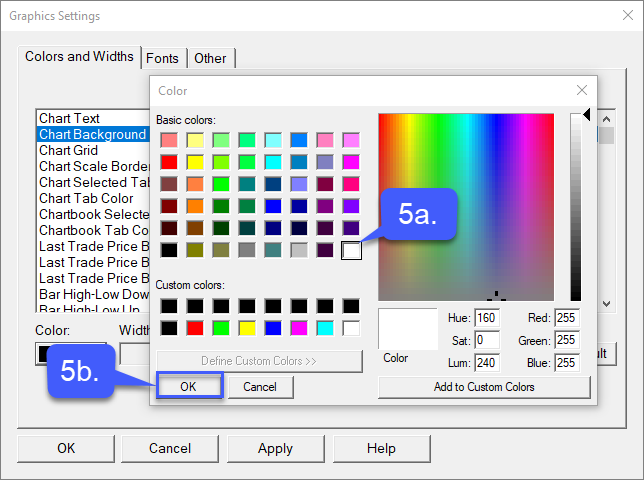
5a. Select the color you wish to display as your chart background. (For our example we’ll select white)
5b. Left Click the OK Button
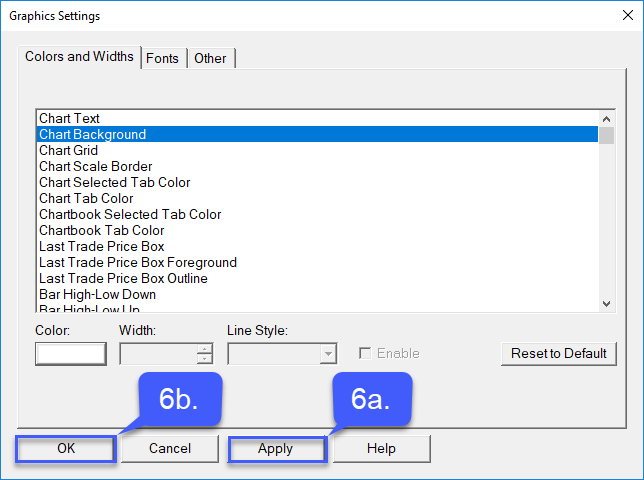
6a. Left Click Apply
6b. Click OK
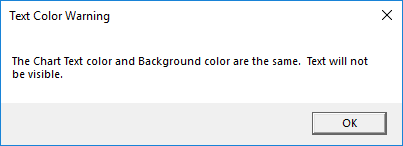
7. If you happen to have the same text color as your new chart background, you will receive a warning message. Please follow the same process, but select Chart Text option under the Graphic settings window to change your text color to something new.
8. Once a new text color has been applied, open a new chart to confirm the made changes.