How do I Change the Background Color of Charts on Firetip?
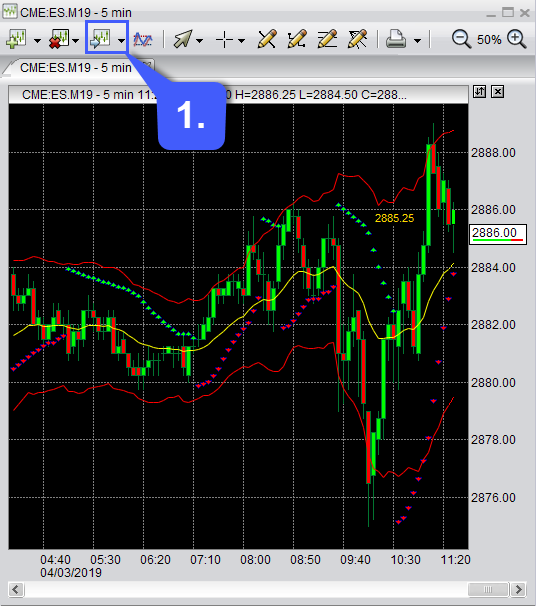
1. With a chart open, left click the Edit Chart button located at the top of the chart window.

Doing so will open the Modify Indicators window. This window allows users to customize their charts by changing the futures symbol, changing chart styles, customizing any indicators they have applied, as well as customizing the background colors of charts.
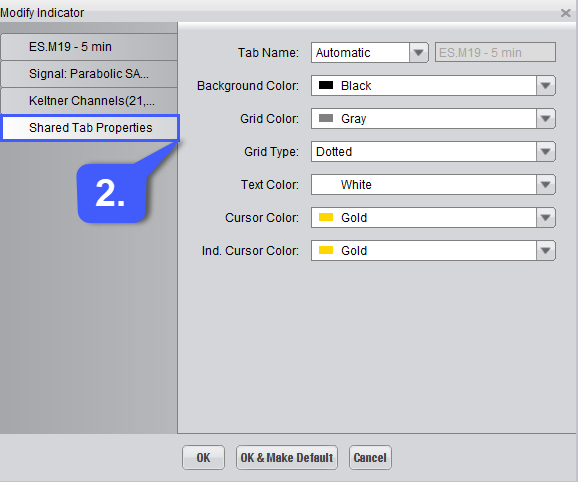
2. With the Modify Indicators window open, left click the Shared Tab Properties on the left-hand side of the window.

The Shared Tab Properties portion of the Modify Indicator window allows users to customize the background color of their chart, grid color, grid type, text colors, cursor color, and indicator cursor color.
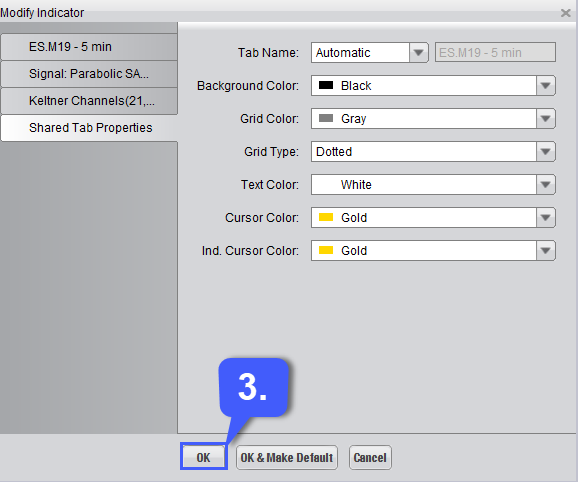
3. Once a chart has been customized to the users liking, to save changes left click the OK button at the bottom of the window. If a user wishes to extend these customization changes to charts opened in the future, they can left click the OK & Make Default button to make these settings the default for any chart opened after this.

