Users have the ability to change the time interval of a chart once it has been opened on their workspace.
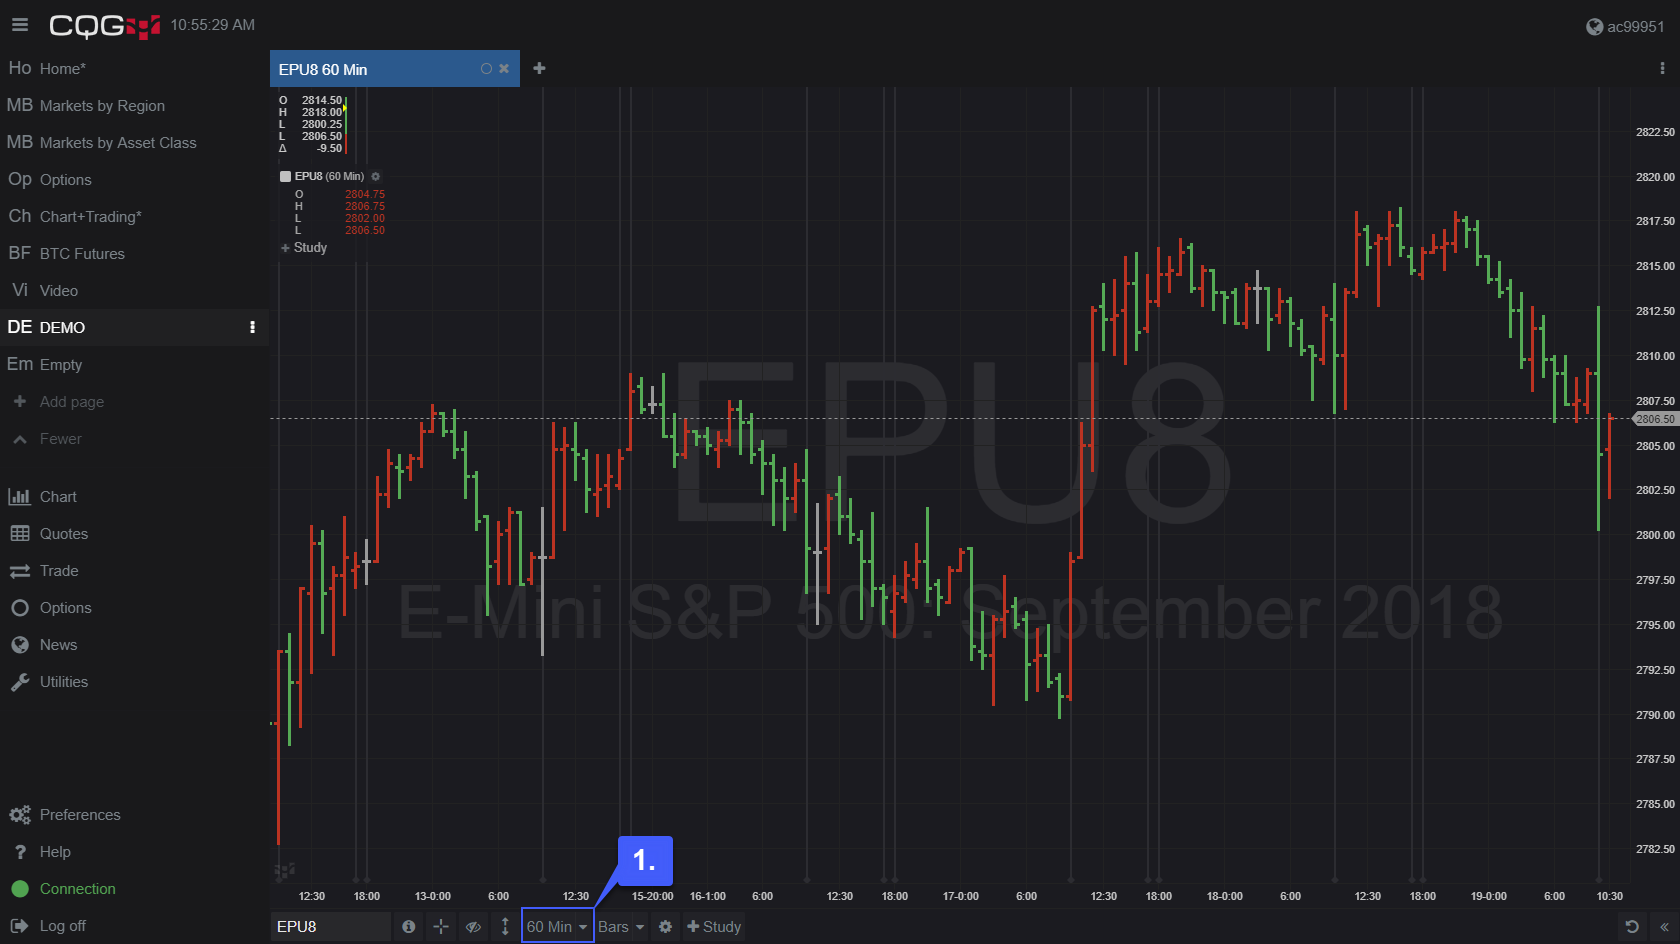
1. After a chart has been opened navigate to the bottom of the platform’s workspace. Located to the left of the chart type is the location to change the chart’s time interval.
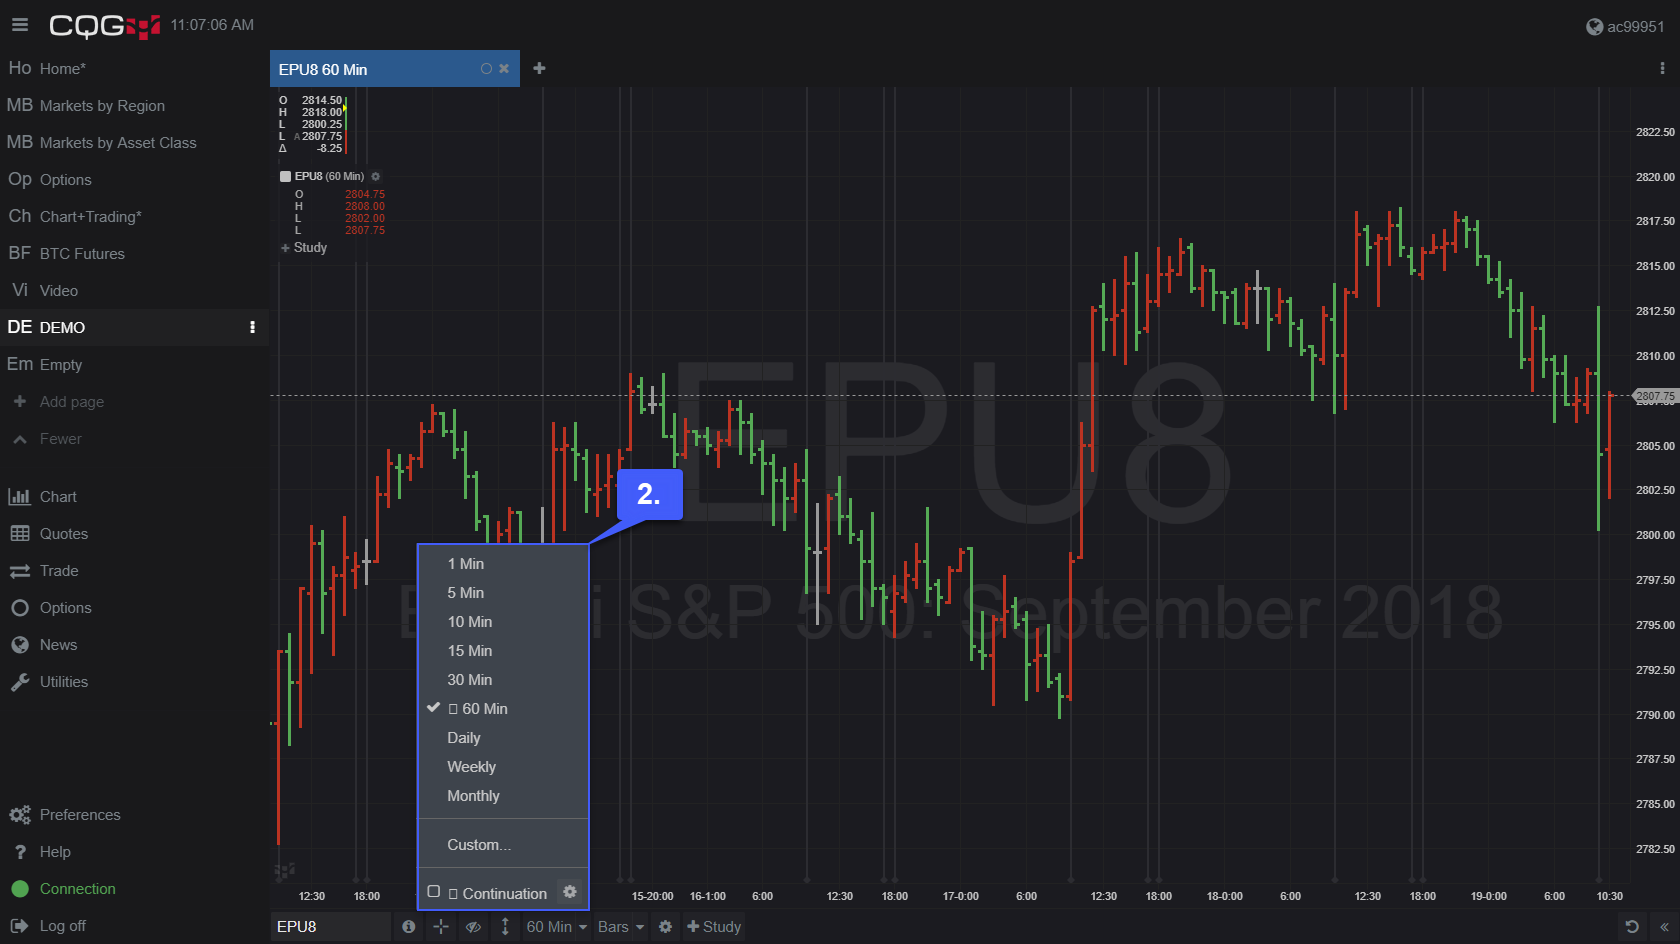
2. Left click the time interval option to display potential time intervals the user can select.
Users have the option of selecting an array of different time intervals. Users seeking to change the time interval of their chart have the option to select anywhere between a 1 minute interval and a 60 minute interval, the platform default. Users can also select a time interval of daily, weekly, monthly, or even customize their own time interval parameters.
A continuous time interval is also offered by CQG. Continuation data is available in CQG Desktop Version 3.1. Customers who wish to access continuation data must work with their FCM to get access. The feature is $25.00/mo. in addition to standard Desktop fees.
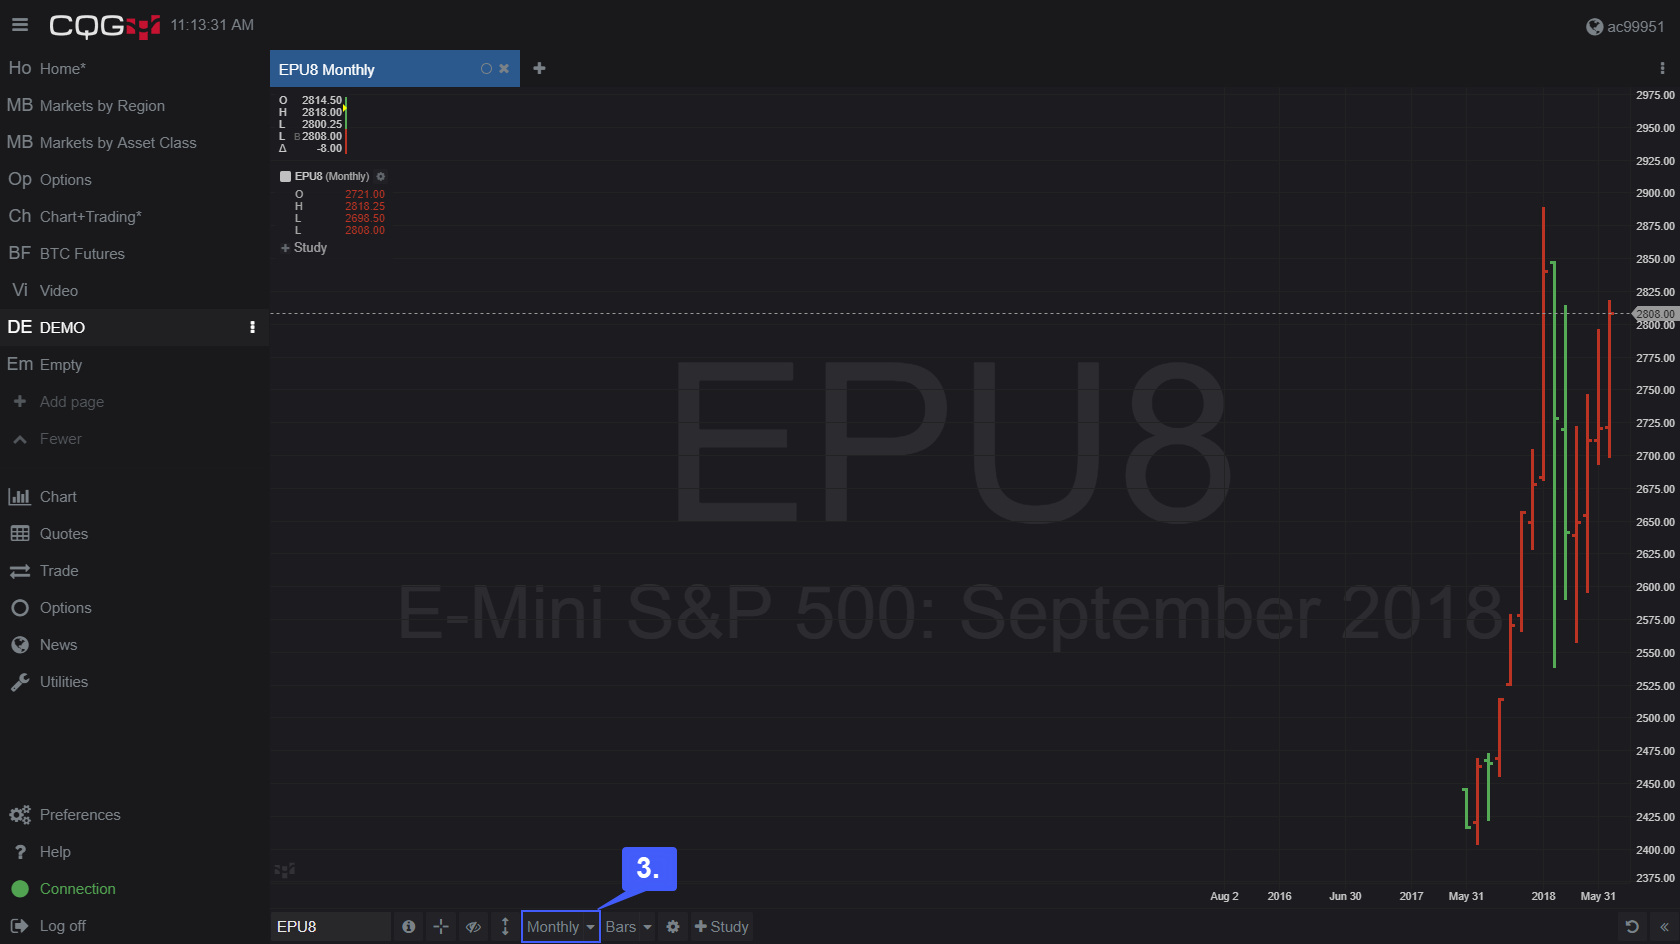
3. In our example below we have changed our 60 min interval to a monthly interval. The interval type is always displayed in the time interval box located beneath the chart.