To change the time interval of a chart, first users will need to open a chart. Feel free to refer to our guide on how to open charts here:
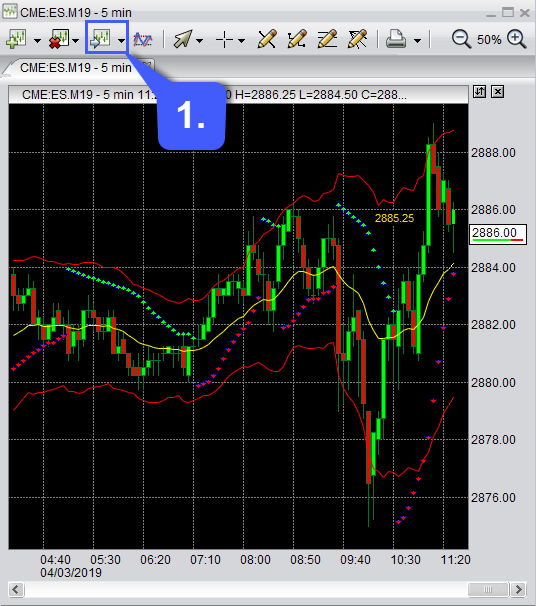
1. Once a chart has been opened left click the Edit Chart button, which is located at the top of a chart. If a chart window has multiple tabs, first left click the corresponding chart tab you would like to customize and change the chart interval for.
Once the Edit Chart button has been clicked, it will open the “Modify Indicator” window. This grants traders with the ability to modify any indicators they have applied to the chart as well as changing the chart style, chart time intervals and customizing chart colors.
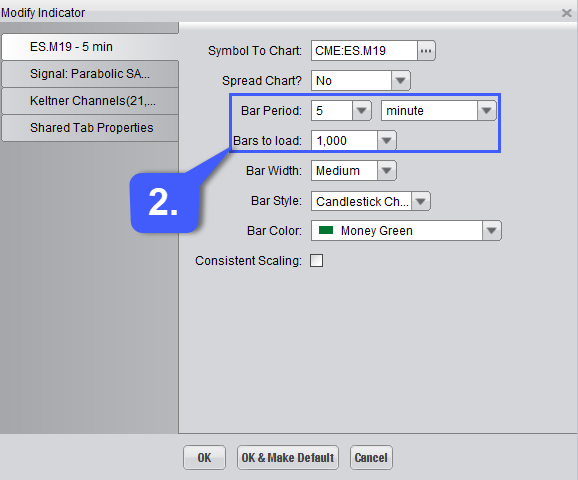
2. To change the time interval of a chart, left click the drop down menus for the Bar Period field and Bars to load. Users have the option of changing their bar period by minutes, ticks and day periods. Users also have the option to select various numerical increments Bars to Load.
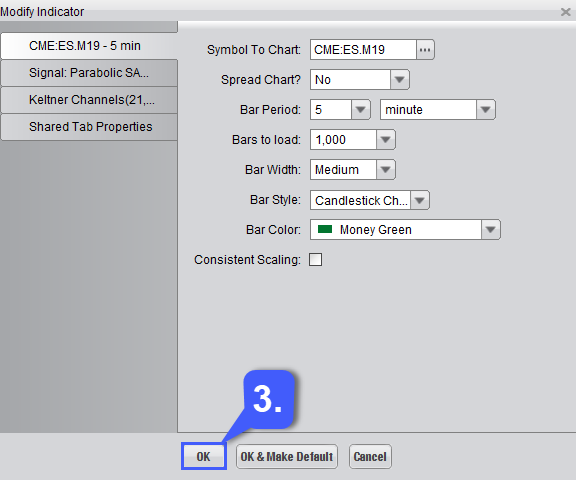
3. Once the user has changed the time intervals of their chart and customized it to their liking, they can apply changes by left clicking the OK button at the bottom of the window. If users want these changes to be applied to any chart opened in the future, they can also choose the OK & Make Default option.