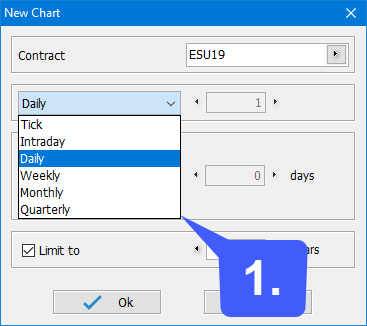
1. When a user first opens a Chart Frame, they will be presented with the New Chart window. By default, the time frame for a new chart will be set to daily. Users have the option of opening the dropdown menu to display timeframes for tick, intraday, daily, weekly, monthly, and quarterly timeframes as shown below:

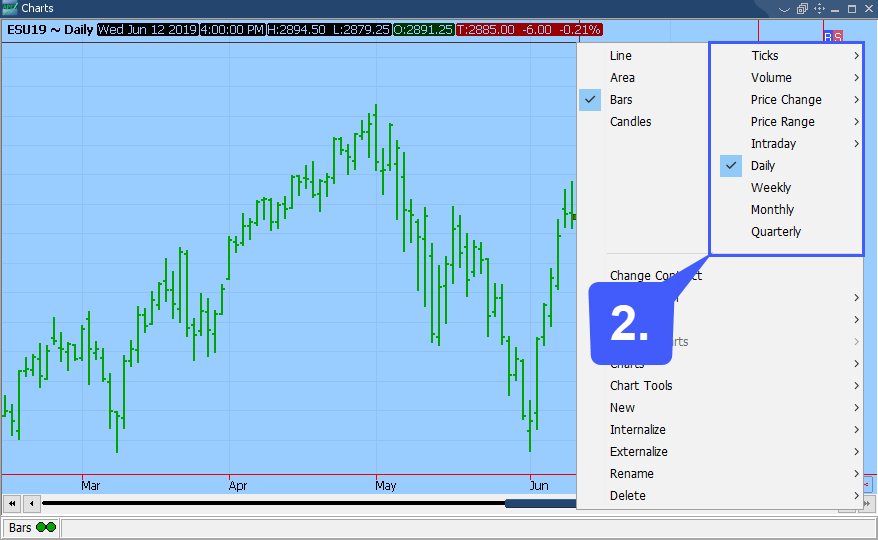
2. Once a chart frame has already been opened, users can change the time frame of their charts by right-clicking within the chart window. Within the context menu that opens up after a user right clicks their chart, the user can select from even more time frames. These time frames can be selected by left-clicking their corresponding option within the context menu.

