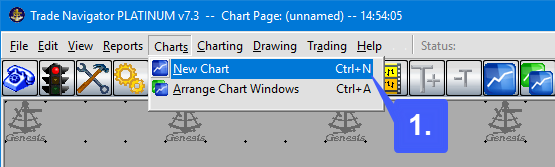
1. Navigate to the top left of the platform window, left click the Charting tab and then select New Chart.
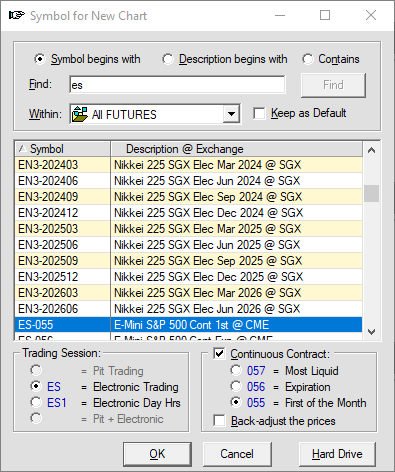
2. In the Symbol for New Chart window manually enter or search for the symbol you wish to open a chart for. In our example we have searched for the E-Mini S&P 500 Contract using the symbol prefix ES.
Once you have selected the contract you wish to open a chart for, you will need to specify the contact month, trading session, and whether or not you would like to open a continuous contract. Once the appropriate fields have been selected, left click the OK button.
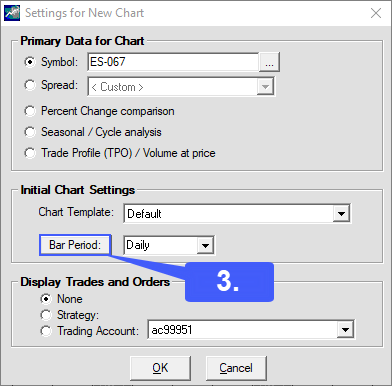
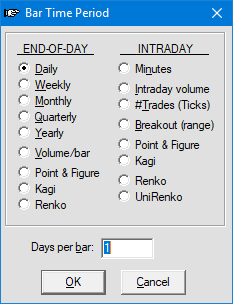
3. After proceeding, the user will then be required to apply the settings of their liking to the chart. In the Settings for New Chart window users can once again modify the contract, apply templates, and change the time interval, style, and much more. To select the time interval of your chart, left click the Bar Period: button.
The Bar Time Period window allows users to first select from chart styles such as Point & Figure, Kagi, and Renko as well as the time interval that is displayed on their chart. Further options can be selected later in the process.
Once the appropriate settings have been entered left click the OK button on both the Bar Time Period window and the Settings for New Chart Window.
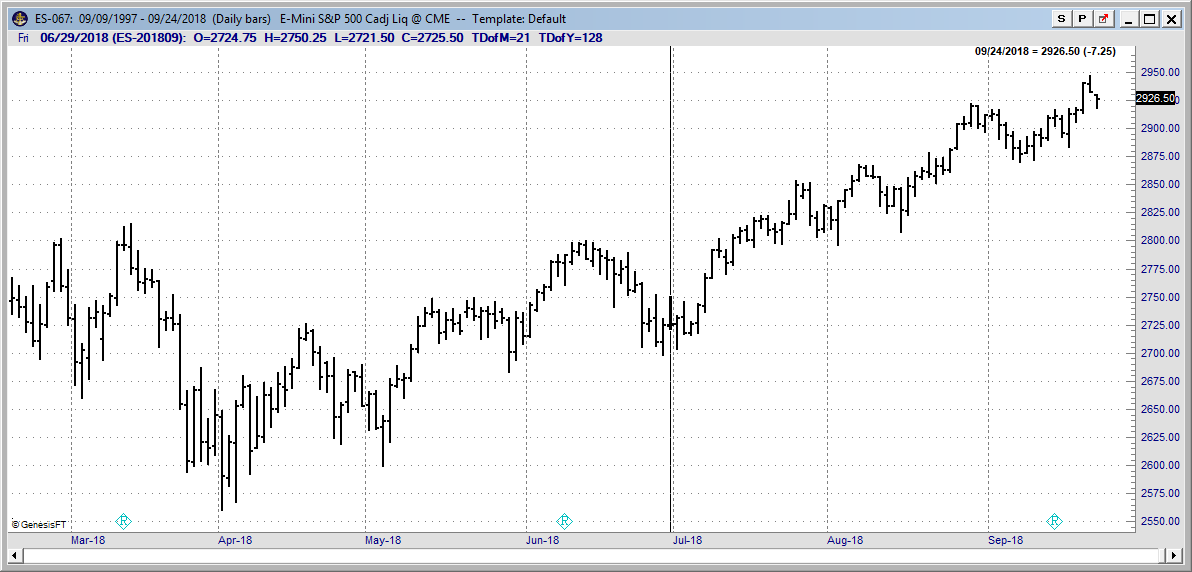
Applying these settings will then open a chart with the specified contract and settings that were applied in the previous two windows.
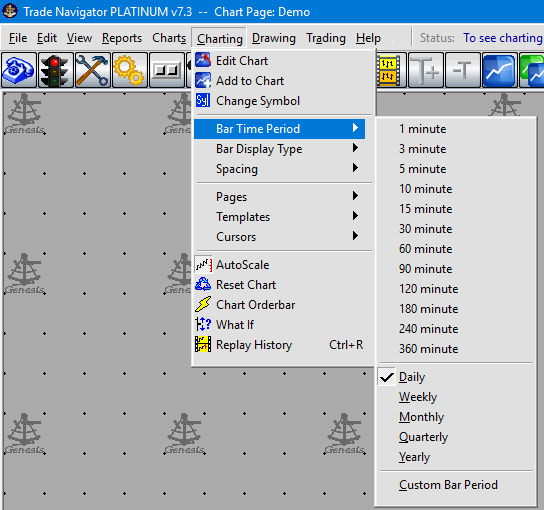
If the previous time interval options were not adequate for the user, an additional list of chart intervals can be found in the charting tab.
4. Navigate to the top of the platform window to Charting > Bar Time Period. From here users can choose from the various time periods available on Trade Navigator.