How do I Change the Type of Chart I am Working with on the BookMap Platform?
BookMap charts are designed to accurately show the entire market liquidity and trading activities. Identify market trends & hidden price patterns with high precision.
There are multiple ways to reconfigure charts on BookMap.
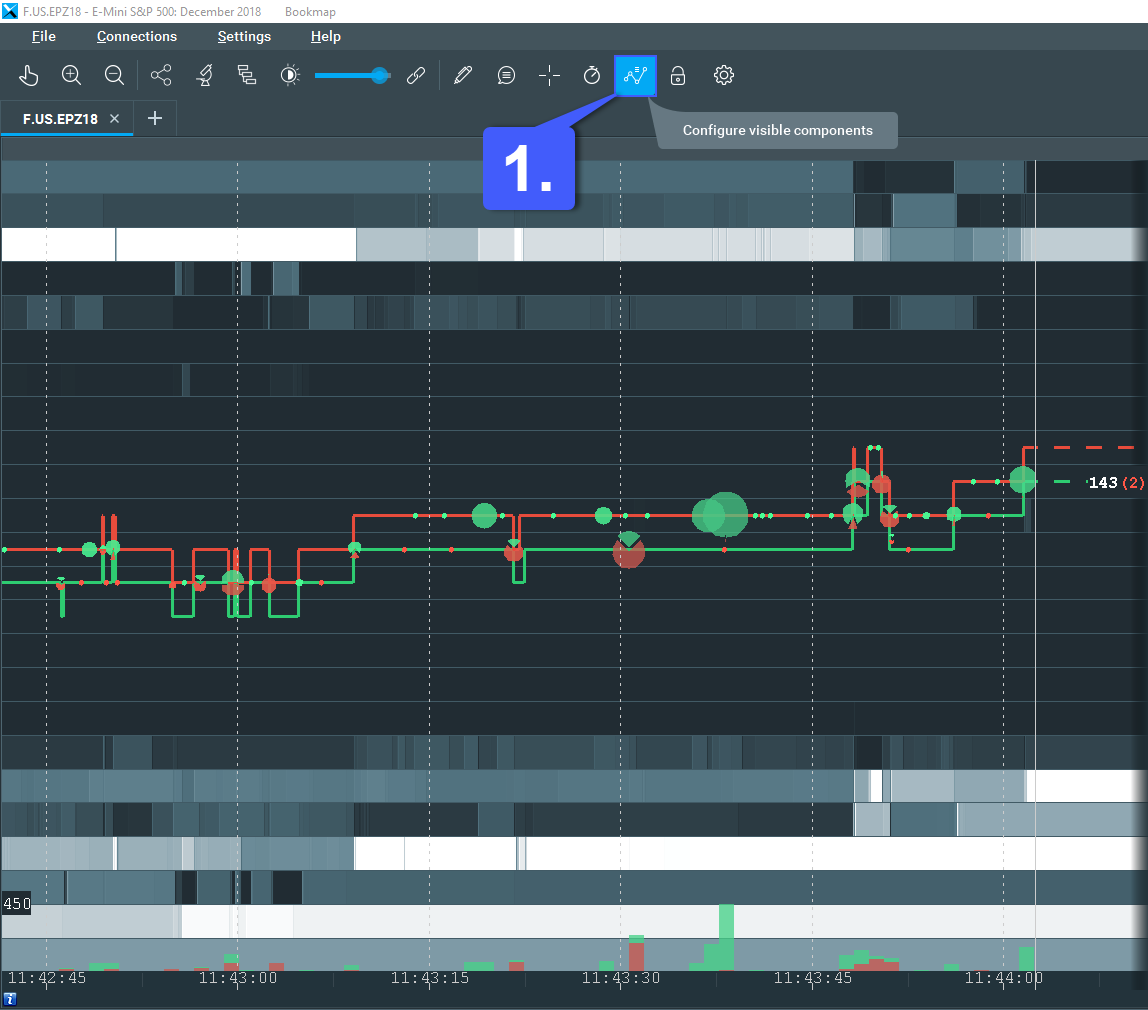
1. To easily change the style of your chart on BookMap, navigate to the toolbar located on the top of the platform window and left click the Configure Visible Components icon as shown below.

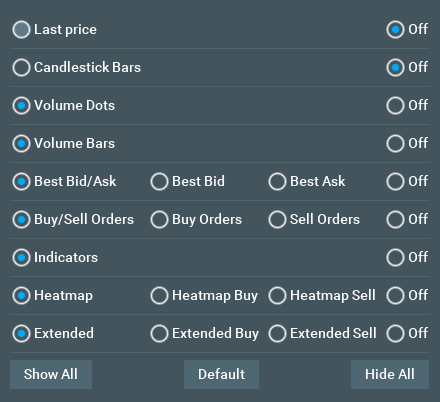
2. Selecting the Configure Visible Components icon allows users to highly customize charts on Bookmap. The image below shows the various components that can be customized on a BookMap chart.

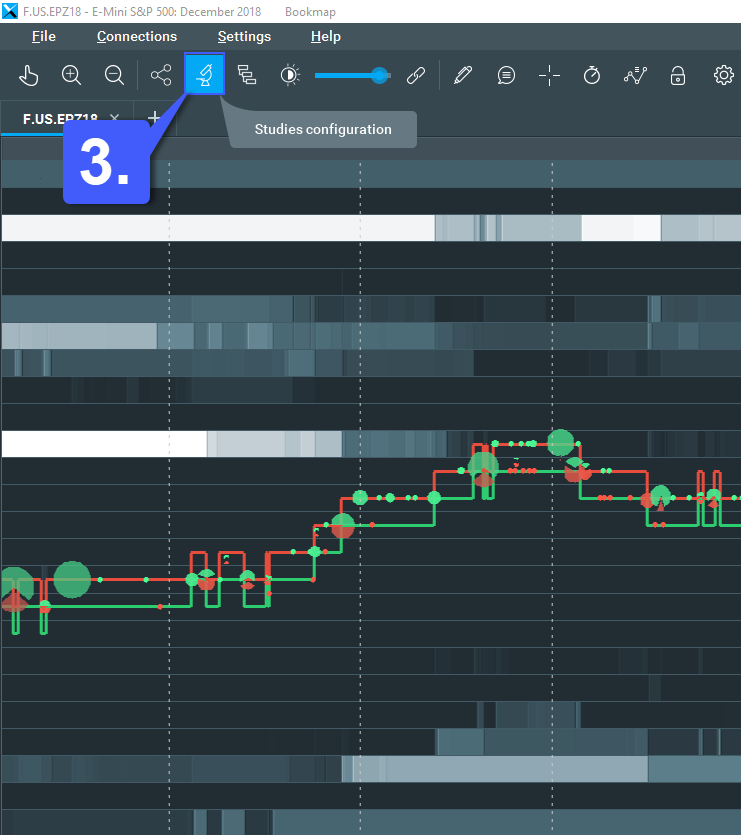
3. Traders can also alter and customize BookMap charts by using the Studies Configuration icon, located along the toolbar at the top of the platform window.

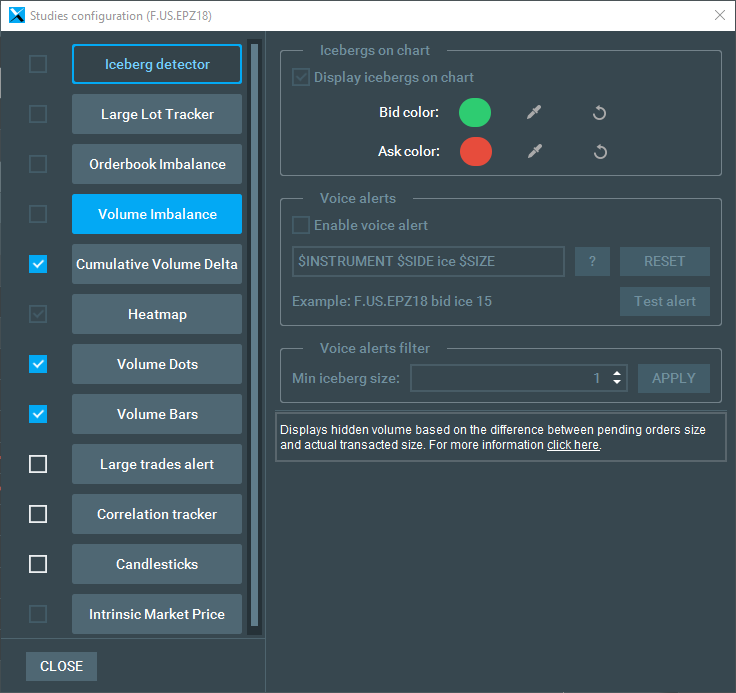
The studies located on the left hand side of the Studies Configuration window can be added to further customize a BookMap chart.

