To change the style or type of chart the user is working with, they will first need to open a chart.
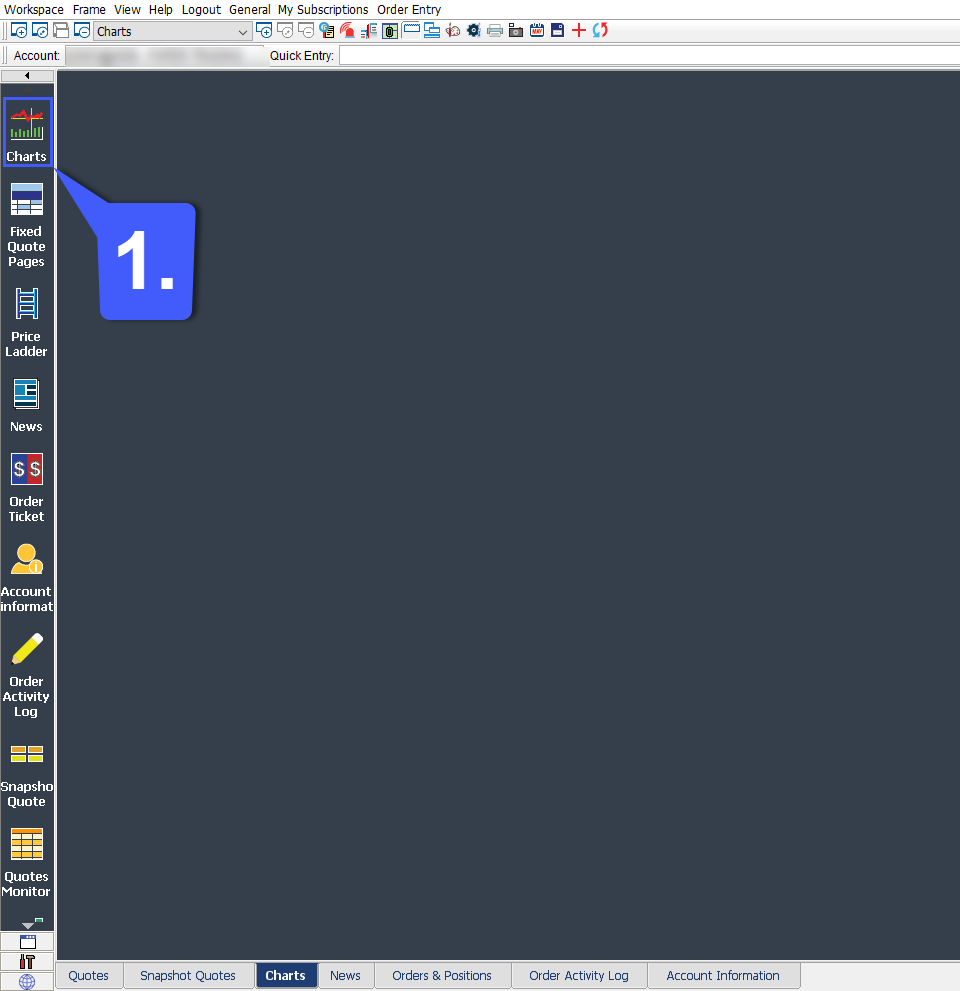
1. To open a chart on the Quick Screen Trading platform, users will need to left click the Charts button located in the toolbar running vertically on the left-hand side of the platform.
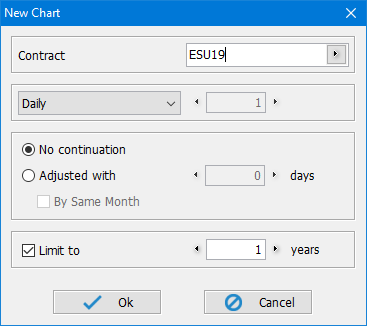
2. Left clicking the charts icon will open the New Chart window. The New Chart window allows users to determine the futures contract being applied to the chart, the chart’s time interval, continuation, and how much data can be loaded into a chart.
First select the futures contract that you wish to apply to the chart. Simply left click the Contract field and type in the symbol root. QST will automatically populate and autofill a contract depending on what is typed into the contract field.
Once a futures symbol has been entered in the Contract field, users will need to determine the time frame, continuation period, and data loaded onto their chart as mentioned above.
3. Once the user presses the OK button, a chart will open with the specified settings as determined in the New Chart window.
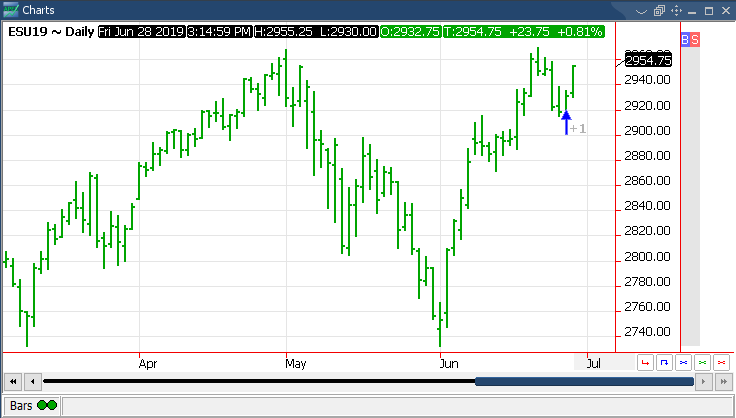
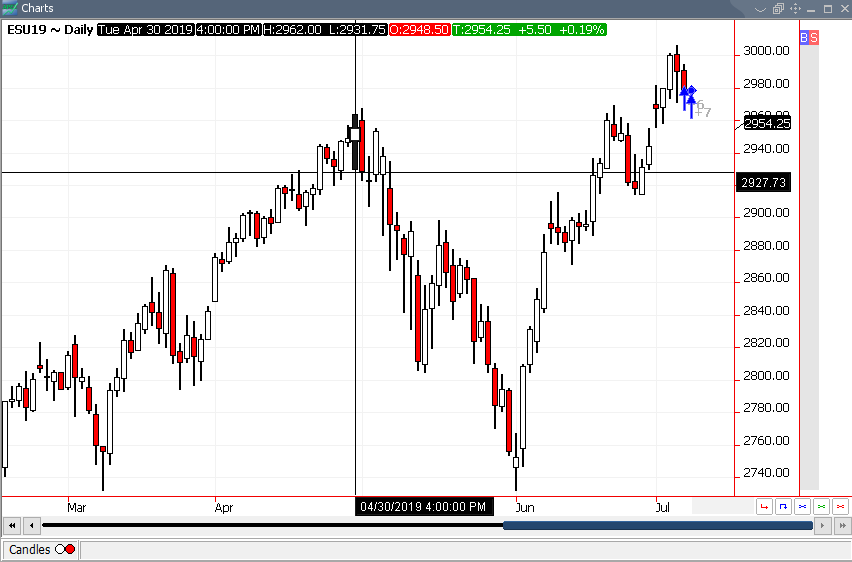
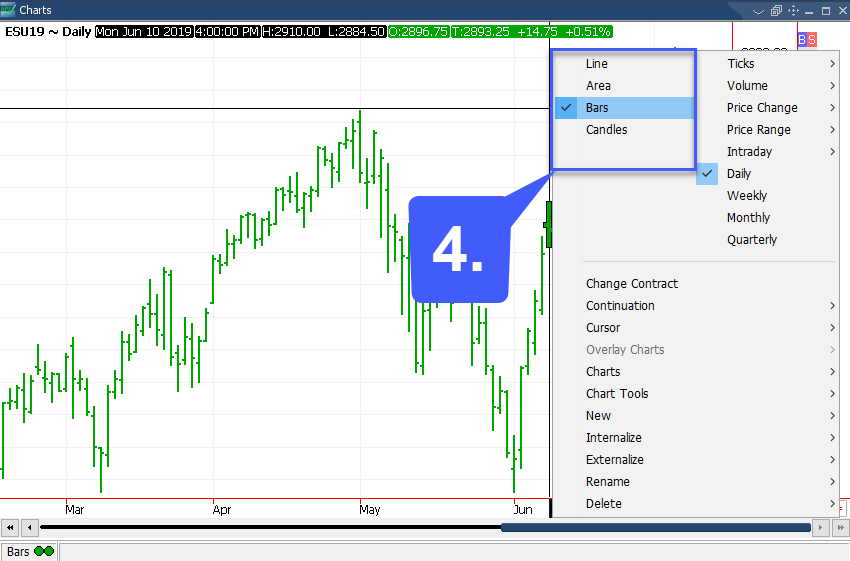
4. With the chart frame now open, users will need to right click anywhere within the Chart interface to open a context menu for the chart. At the top of the context menu, users can choose from several different chart types. Chart types include: line, area, bars, and candles.
The image below is an example of the Candles chart type on Quick Screen Trading: