How do I Change a Chart Type on R Trader Pro?
To change the style of chart, first users will need to open a chart.
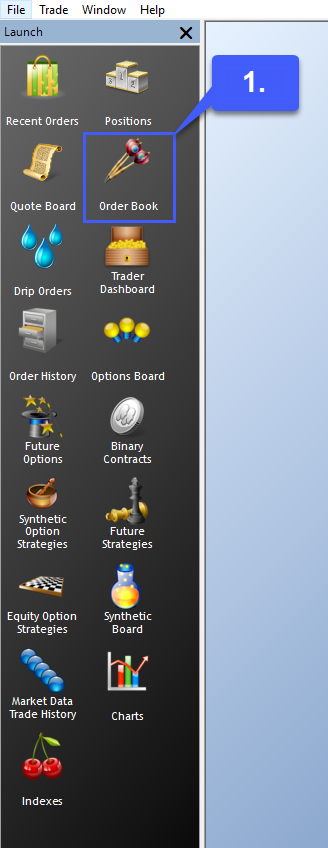
1. Left click the Charts button to open a chart window.
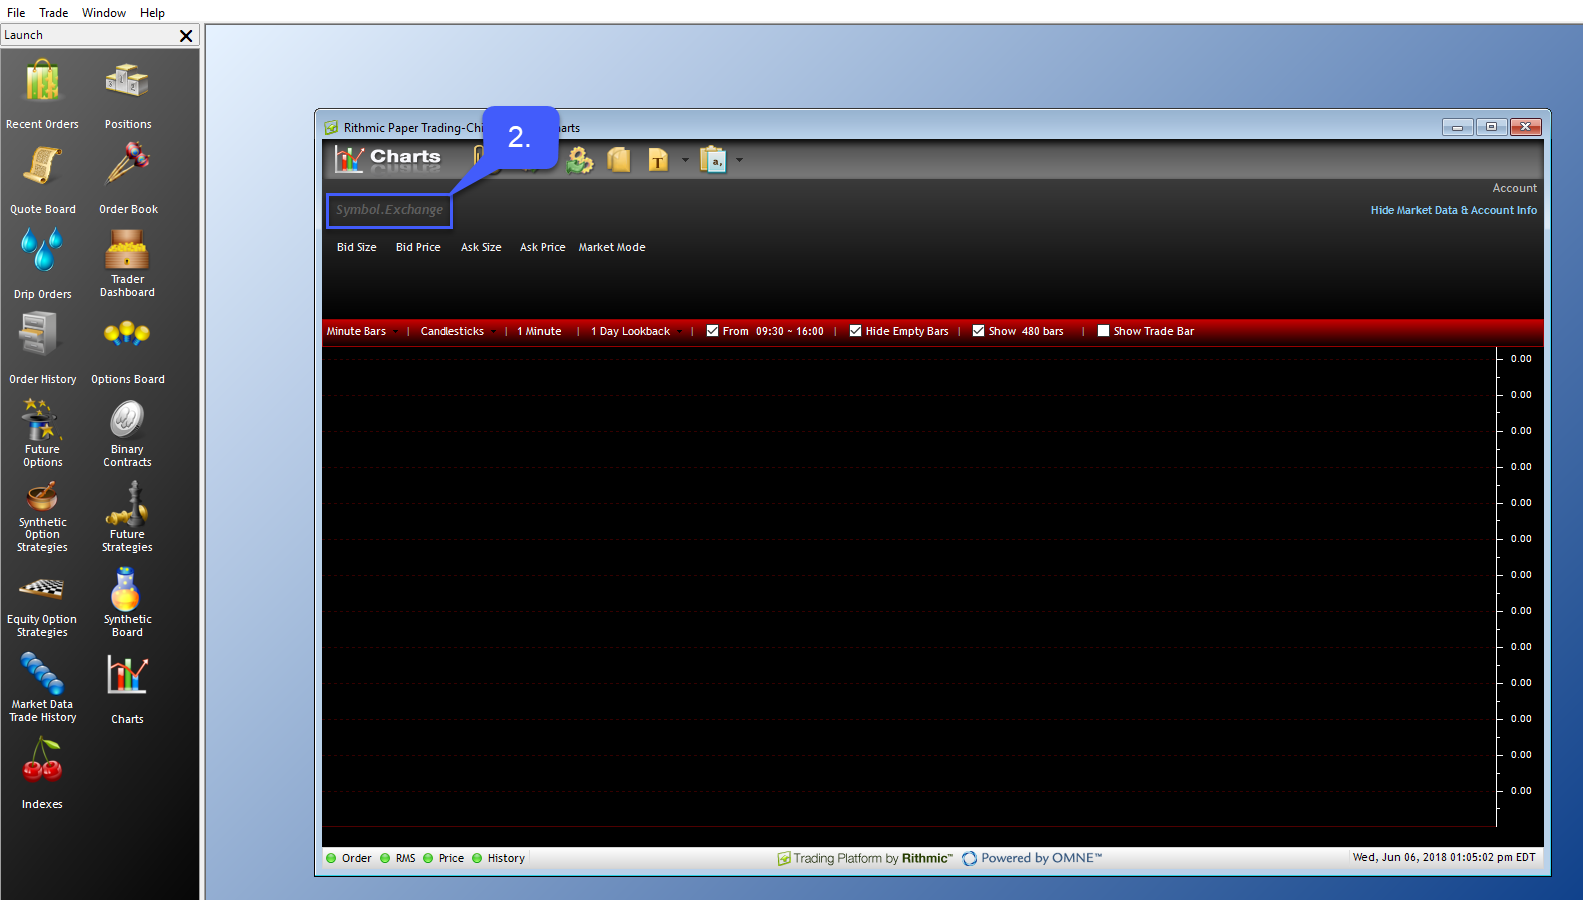
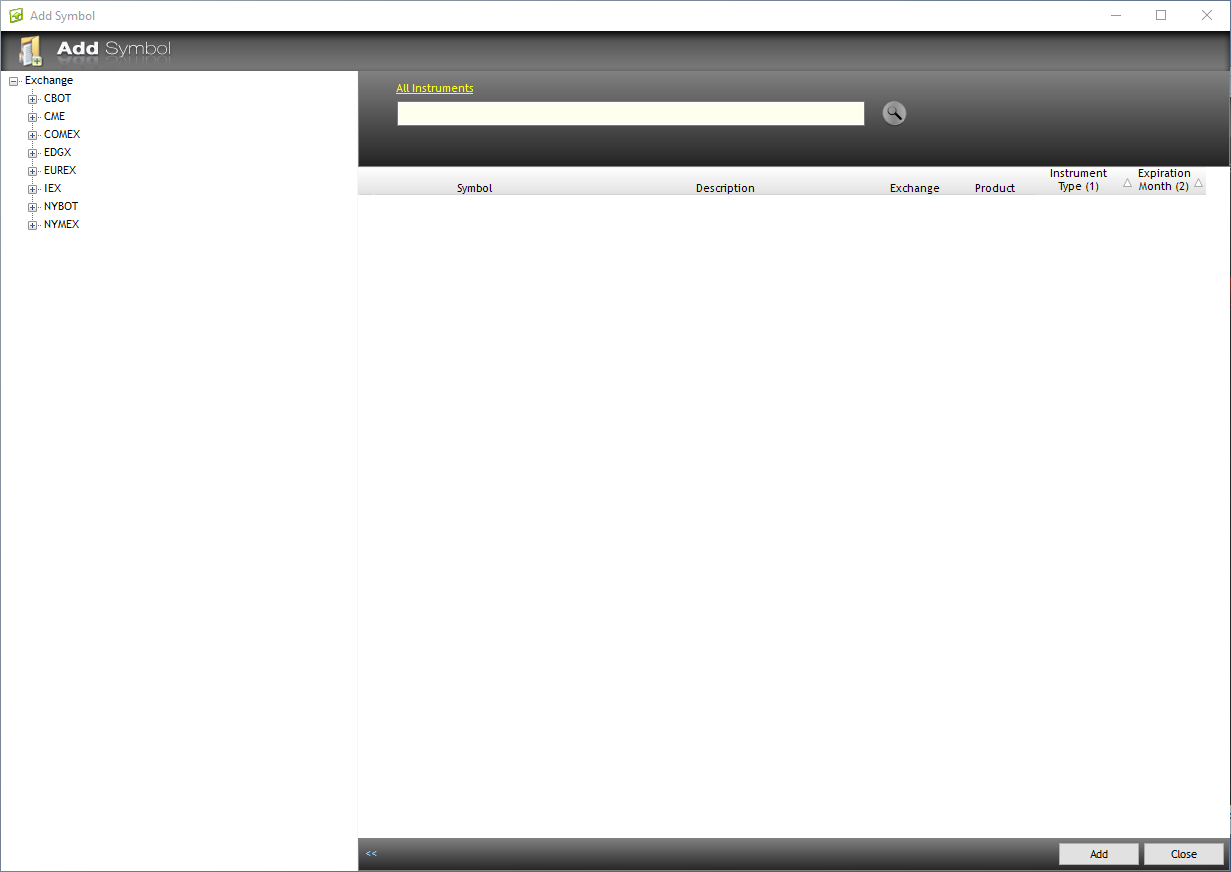
2. Once open, navigate to the top left of the window and left click the Symbol.Exchange search bar to specify the contract you wish to open a chart for.
If you already know the specific contract you wish to trade, users can manually enter the contract. If not, double click the search bar to open an Add Symbol window.
3. Once open users can navigate through the corresponding menus to find the symbol of their choice.
This can be done through either the search bar at the top of the page or the Exchange menu on the left.
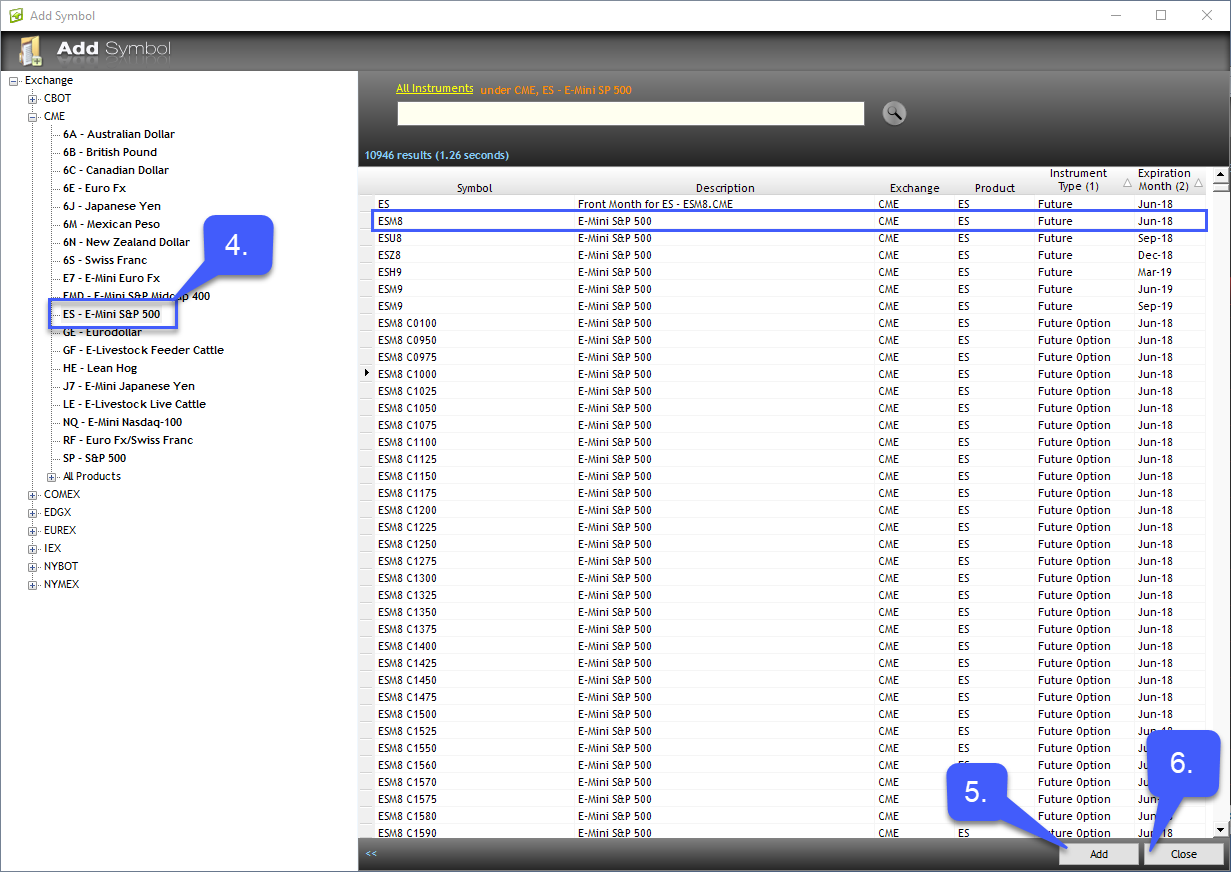
4. After the symbol has been found double click on the symbol to expand the different contract options and view the different trading months.
5. To open a contract highlight it and left click the Add button in the bottom right corner of the platform. For our example we will open a chart for the E-Mini S&P 500 of JUN 2018.
6. Once a contract has been added close the Add Symbol window to find the opened chart in the background.
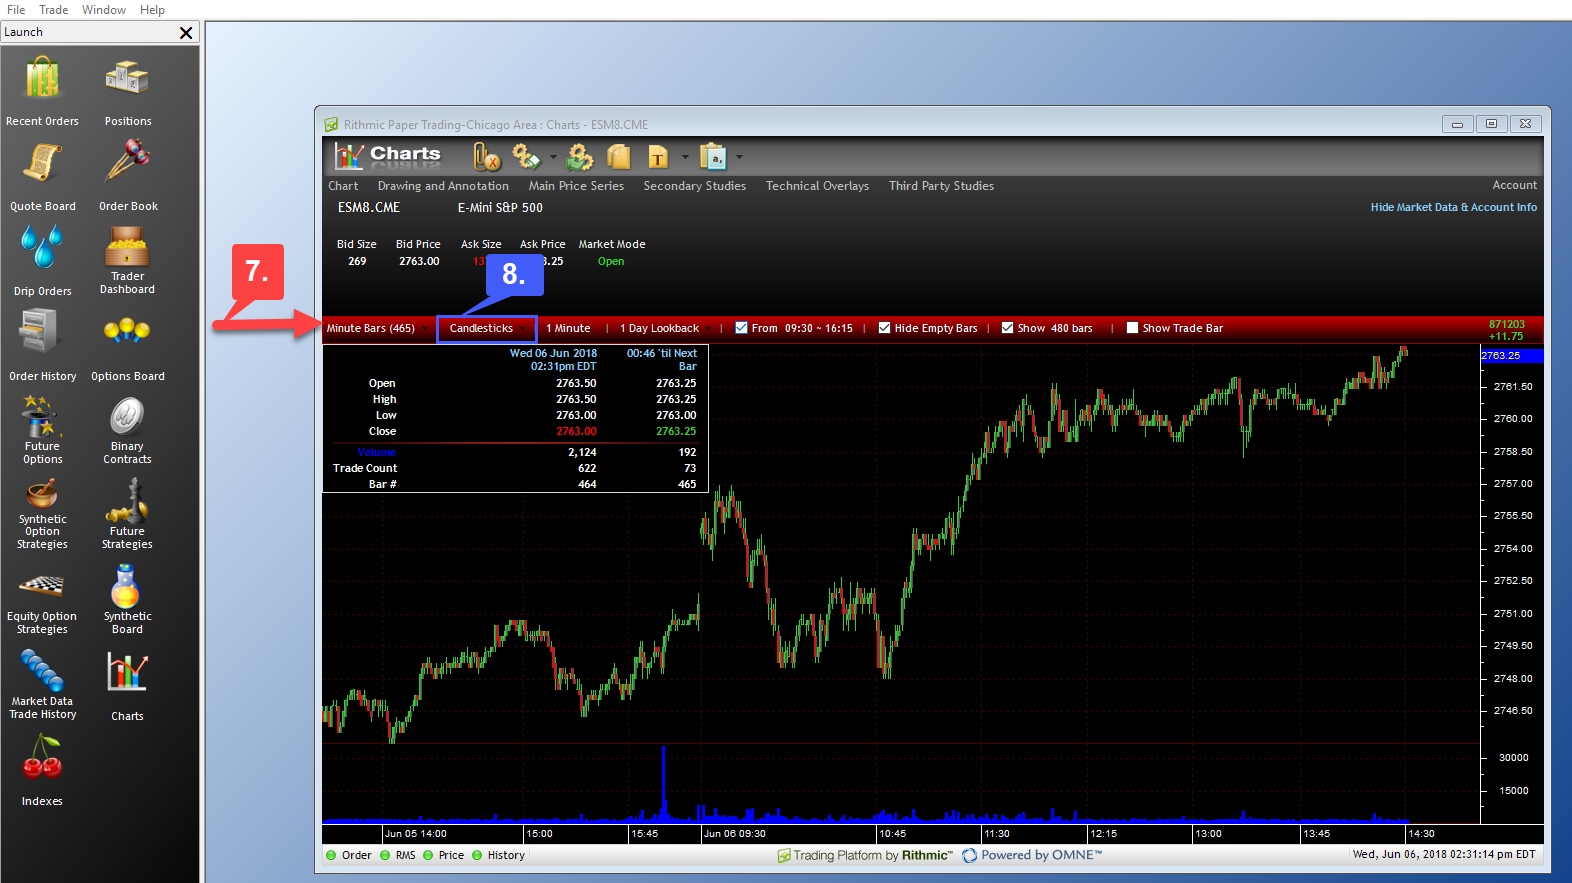
7. Once a chart is open navigate to the red ribbon running along the top of the chart. There are several various dropdown menus located along this ribbon that allow for chart customization.
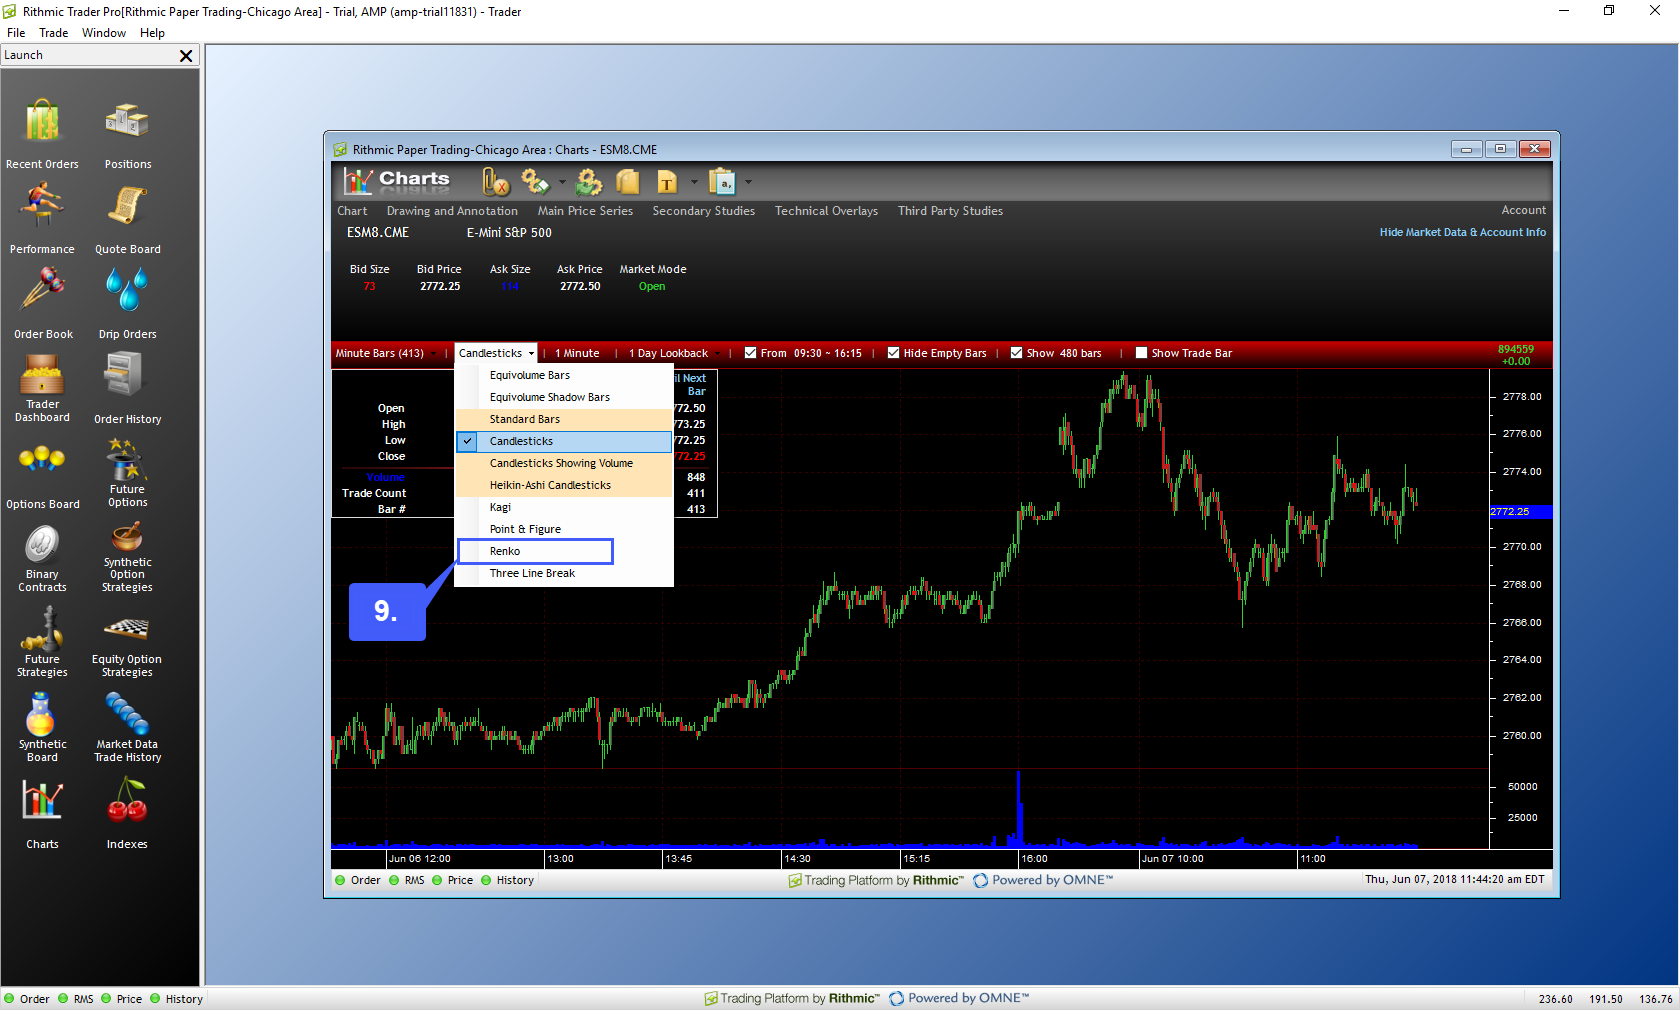
8. To change the type of chart, users should left click the option labeled Candlesticks, which should be the default chart type.
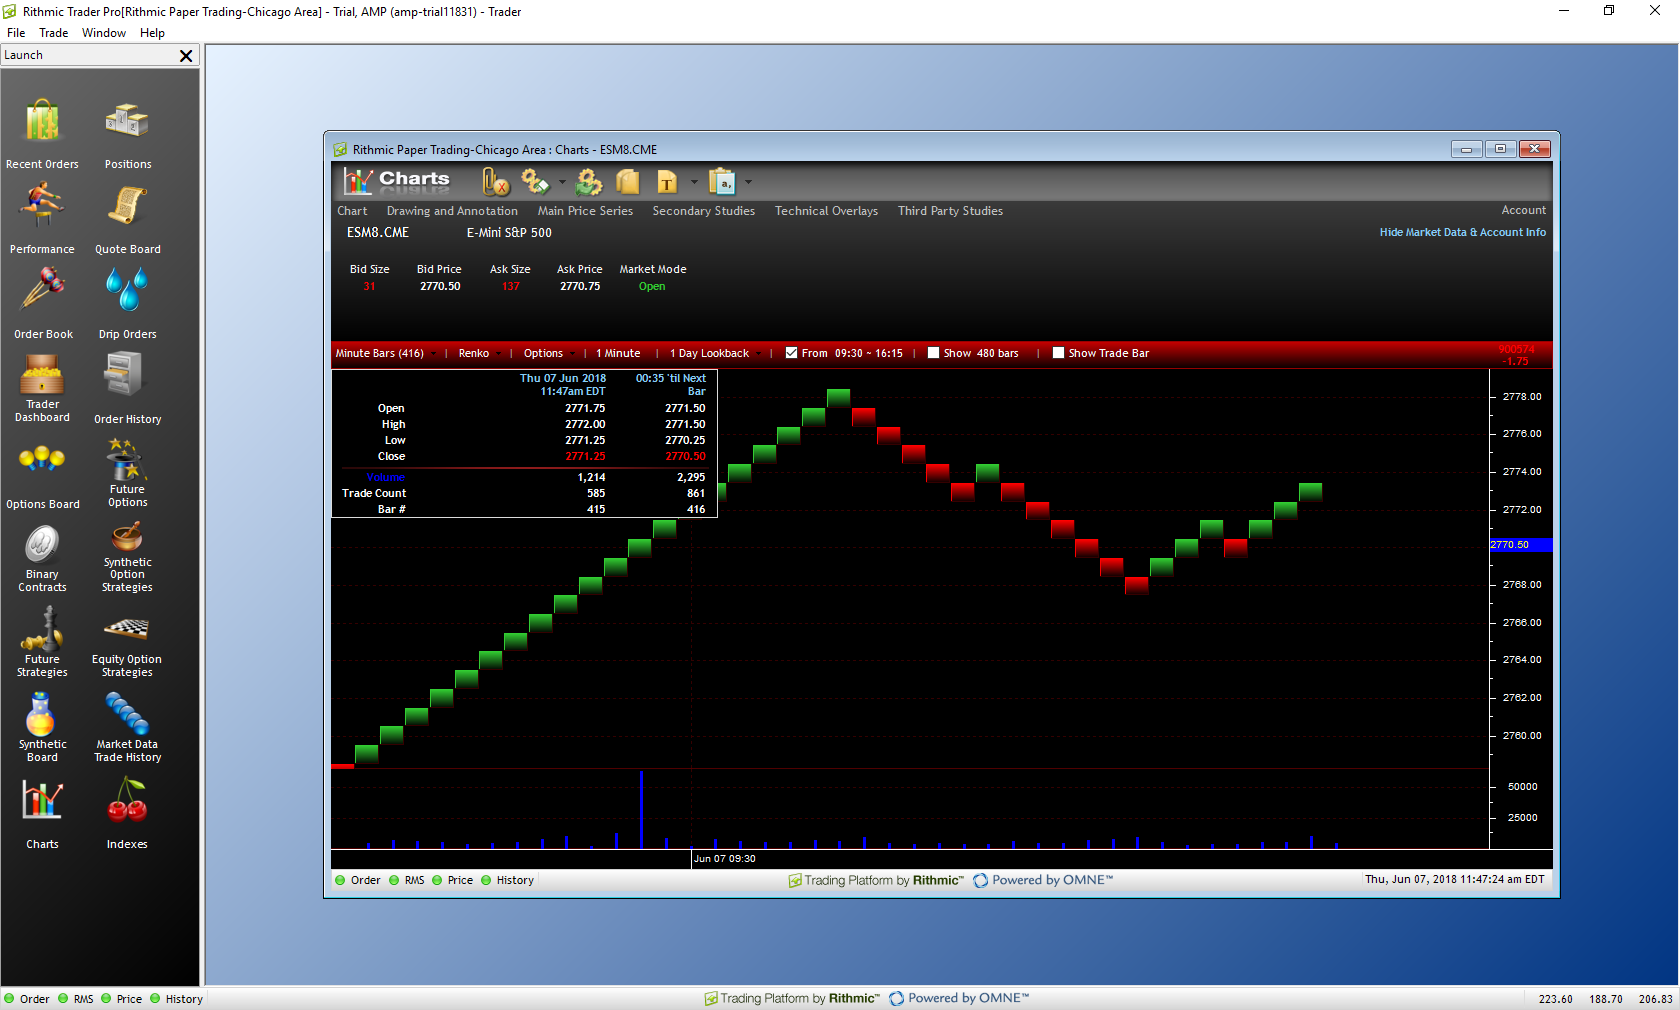
9. Once expanded users may select the chart type of their choice. For our example we will be selecting the Renko option.
