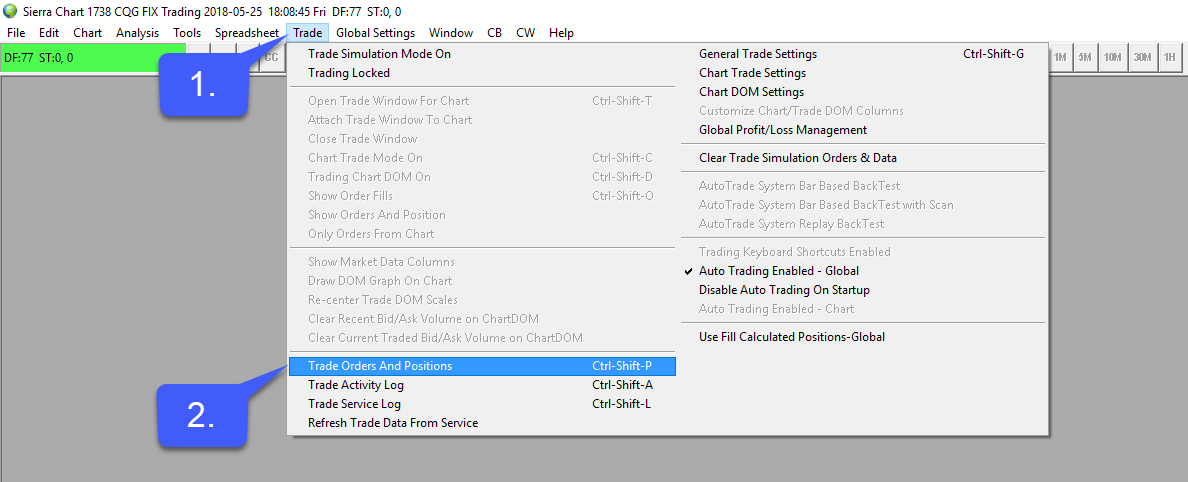
1. Navigate to the Trade tab on the top of the platform window.
2. Left click the Trade Orders And Positions tab.
3. Once the trade activity log is open users can filter by Orders, Fills, or All Activity by clicking the dropdown menu furthest left of the window.
4. Users can filter trade activity based off Order ID.
5. Users can filter trade activity by Symbol Type.
6. Users can filter trade activity by Account Number.
7. Users can filter trade activity by Date Range.
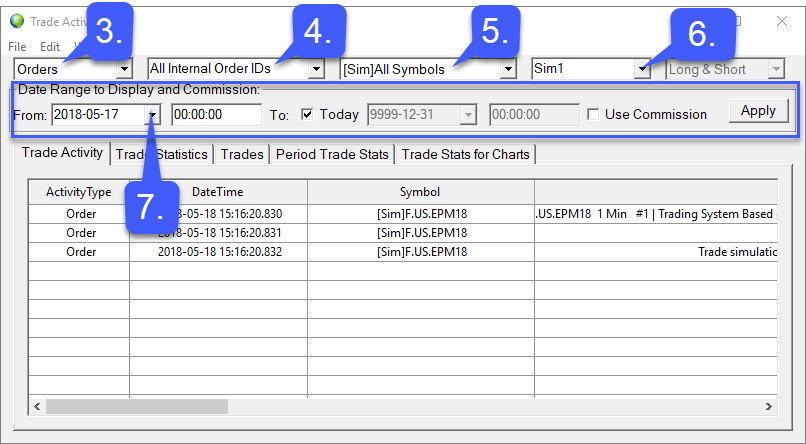
Users can also filter based off trade activity, detailed trade statistics, trade type, period trade stats, and trade stats for charts.
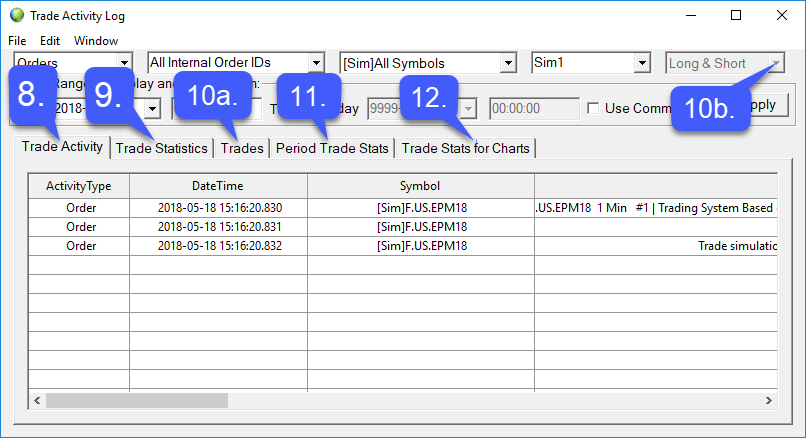
8. For all trade activity, left click the Trade Activity tab.
9. For statistics such as total profit/loss for closed trades, gross profit, gross loss, and profit factors left click the Trade statistics tab.
10a. To filter by order type: Select the Trades tab.
Once selected users can filter by order type by:
10b. Clicking the drop down menu in the upper right hand corner of the platform.
11. For detailed period trade statistics such as the period, profit/loss, running P/L, gross profit, gross loss, % winners, drawdown, runup and more select the Period trade stats tab.
12. For statistics related to charts, select the Trade Stats for Charts tab.