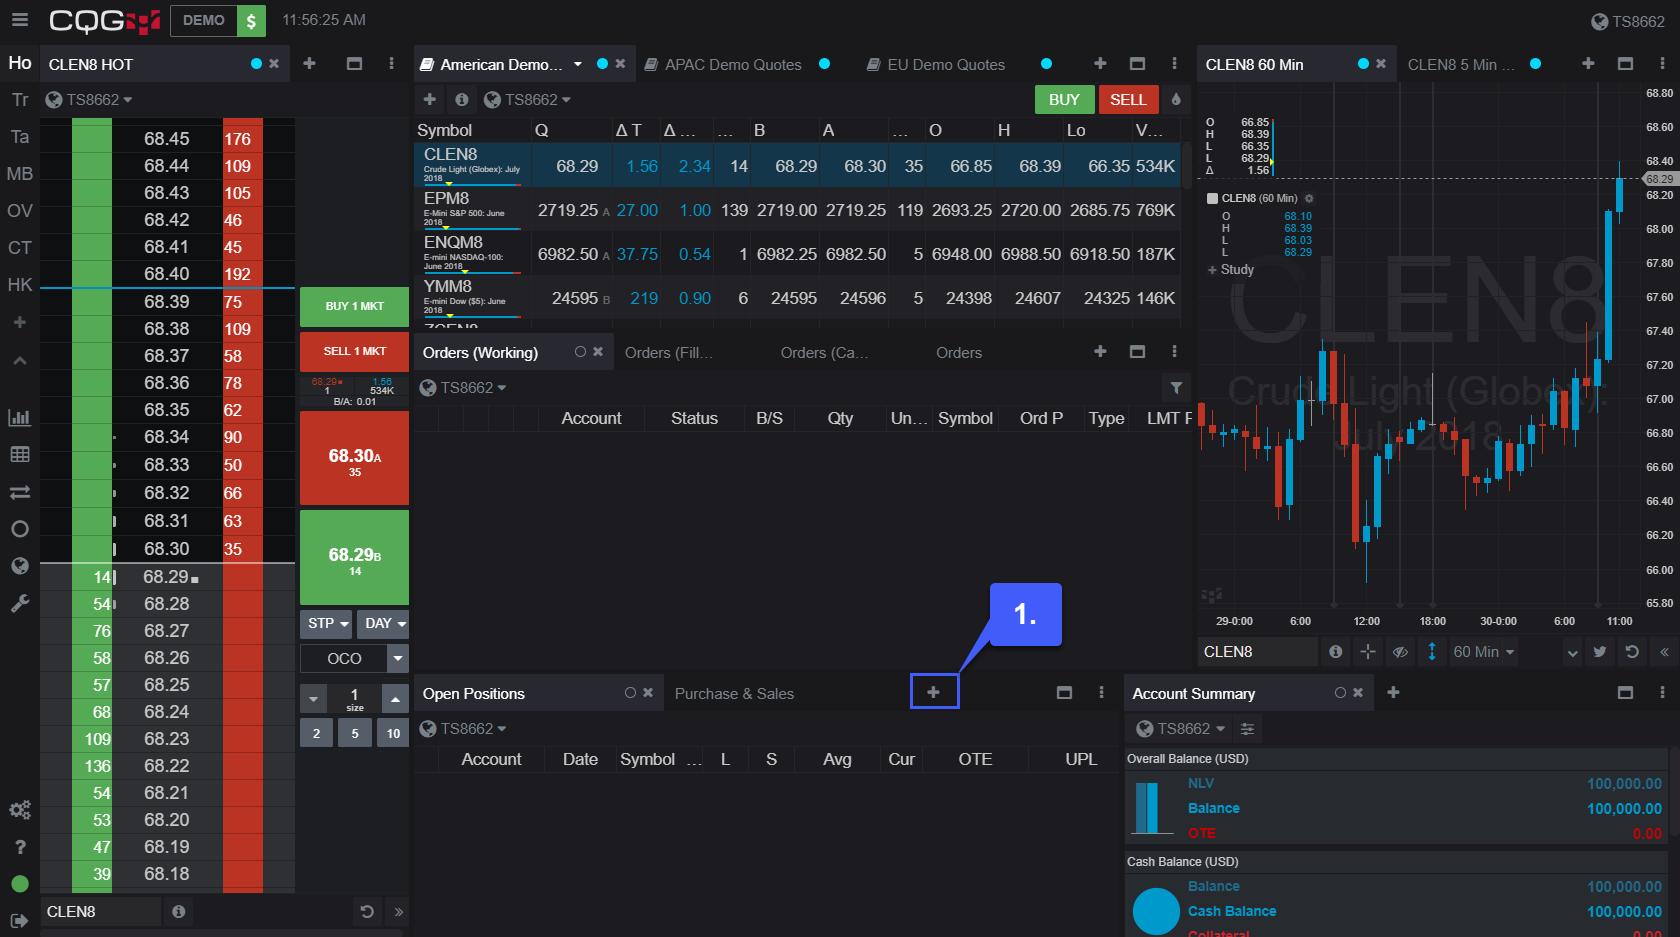
Users can open a chart by clicking on the + button, otherwise known as the Add Widget button. The Add Widget button can be found accompanied with any preexisting widget already on the platform. This button can also be found as the center piece of any blank or new workspace.
1. Left click any + button found accompanying a preexisting widget on our workspace. Below is an example of one of the many + Add Widget buttons found on our screen.
2. Once selected users can now select the type of widget they would like to open. For our example we will be opening a bar chart widget.

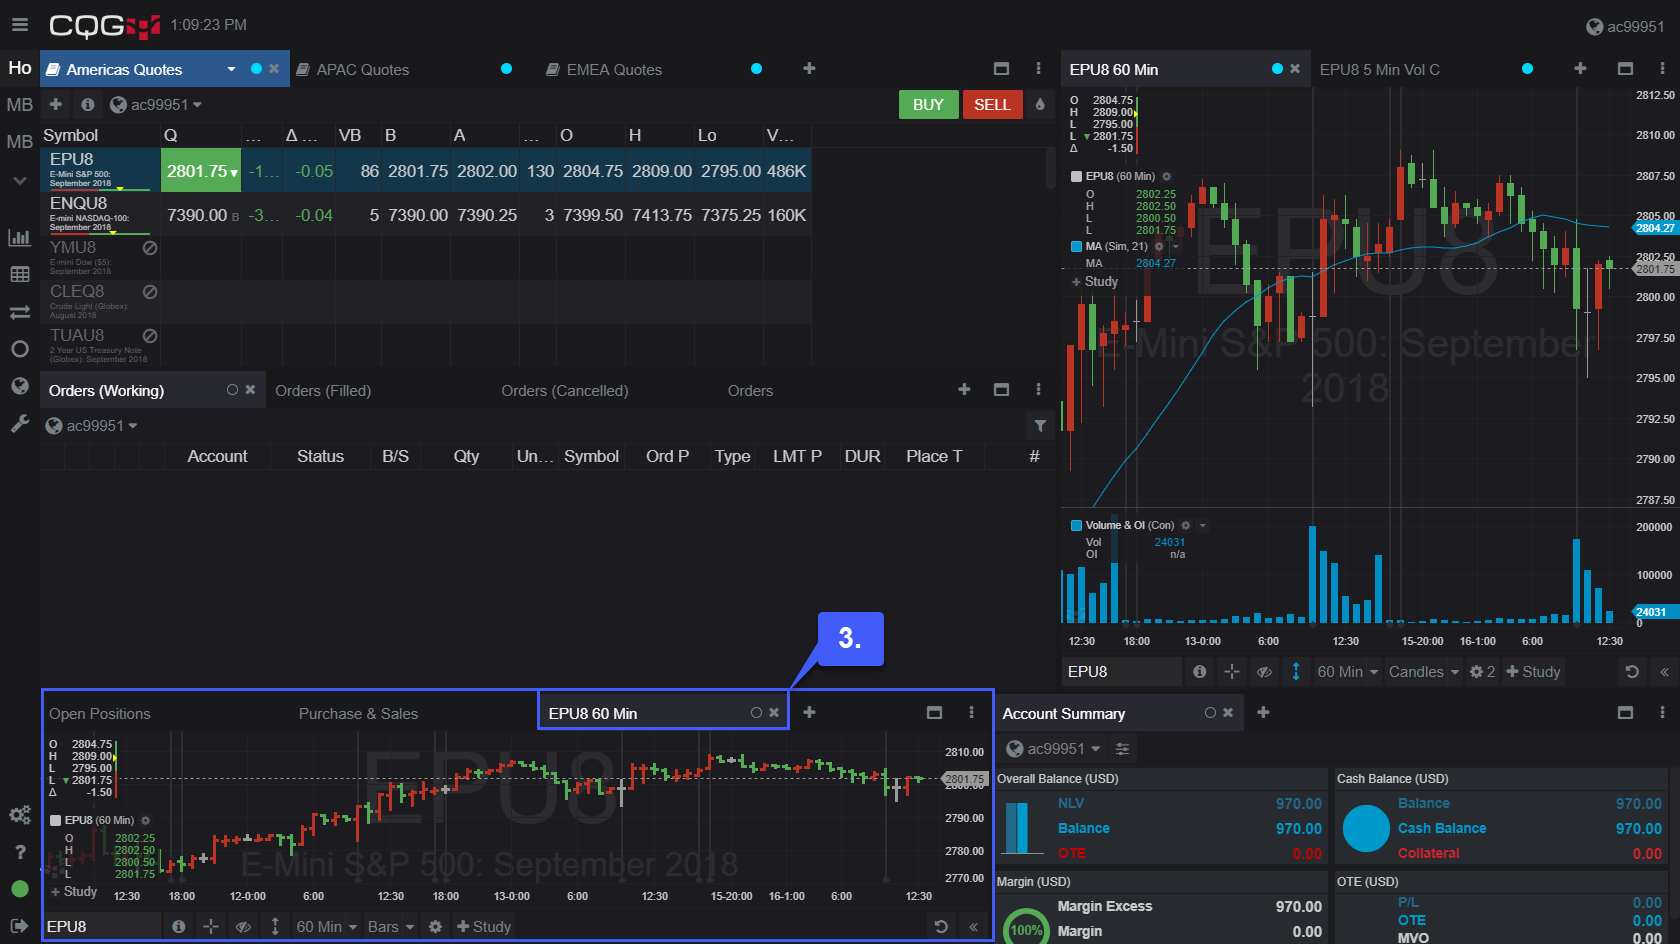
3. After choosing the bar chart option, a bar chart will automatically be allocated to the desired location. Each + Add Widget represents where the added widget will place placed. In our example below, a bar chart will be added to the same widget space as the Open Positions widget since this is where we clicked the + Add Widget button.
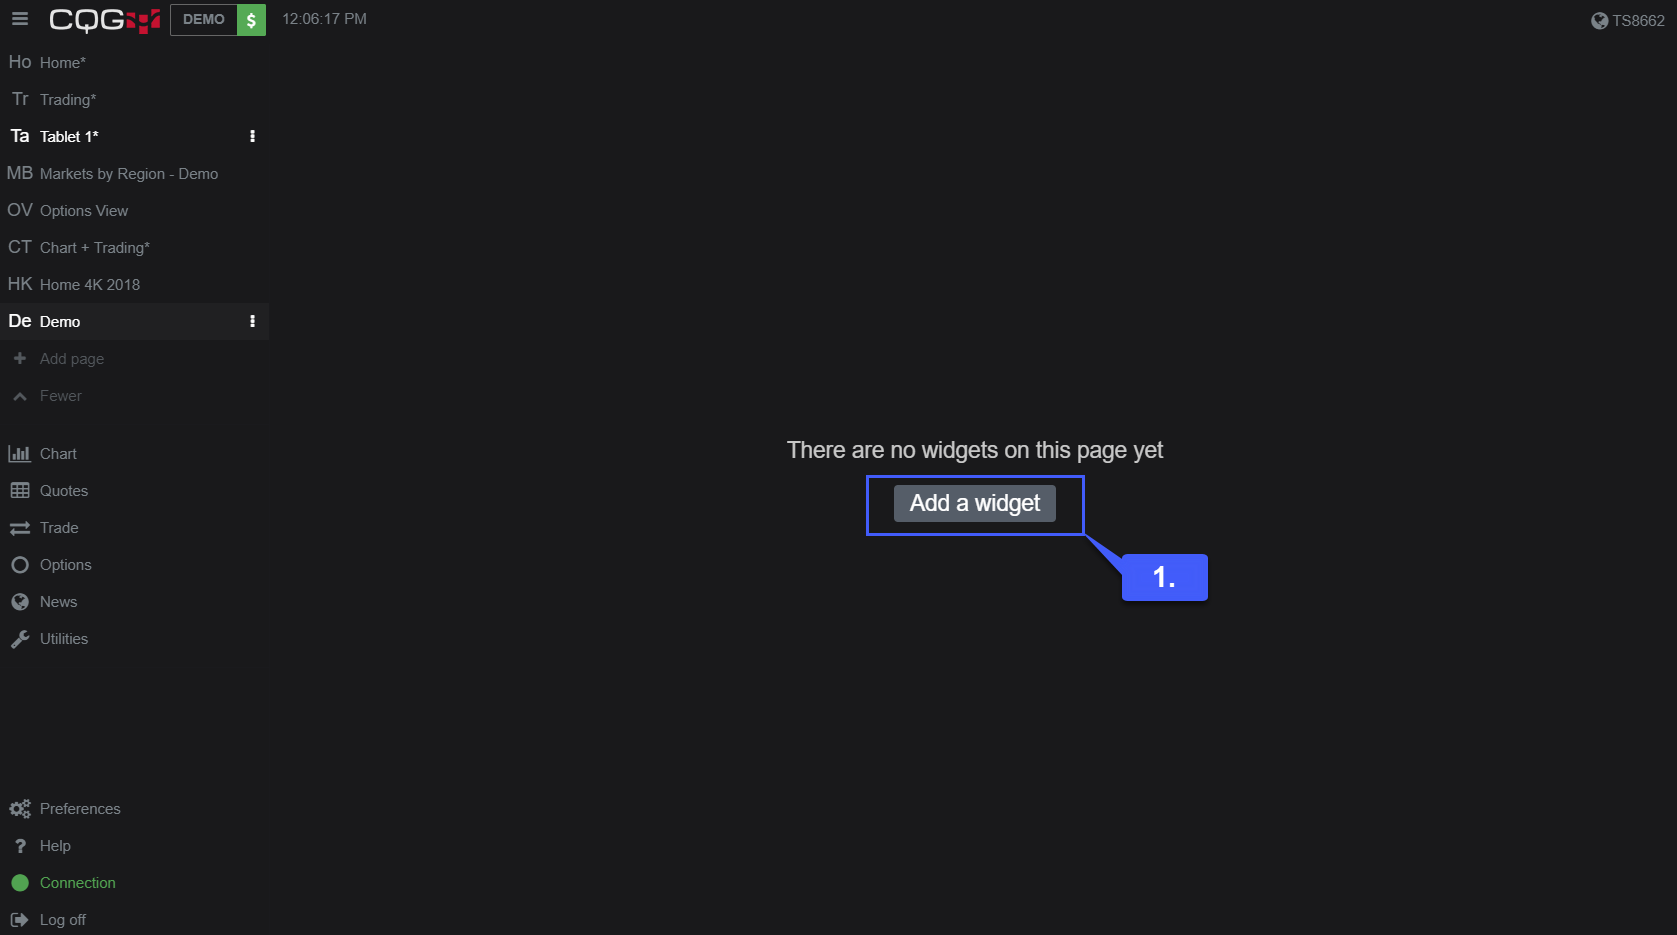
Users also have the option of opening up a chart on a brand new workspace.
1. Once a new page has been added, users can add widgets on their new page by clicking on the Add a Widget button.
2. After the Add a widget button has been opened, select the style of chart you would like to open under the Chart section by left clicking the corresponding chart type.
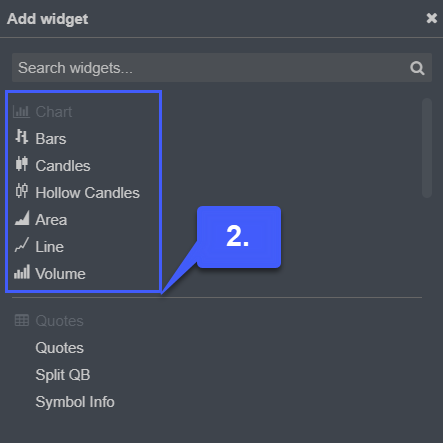
The selected chart type will fill the entire screen because it is the only widget that has been added so far.