To open a chart on the Firetip trading platform, users have several options to choose from. The easiest way is through the Trading Matrix.
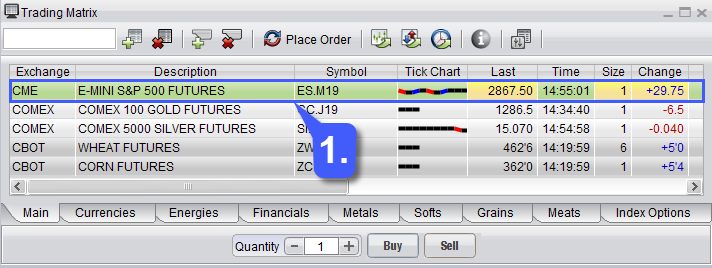
1. Navigate to the trading matrix and left click a futures contract to highlight it. (Highlighted contracts will turn green)
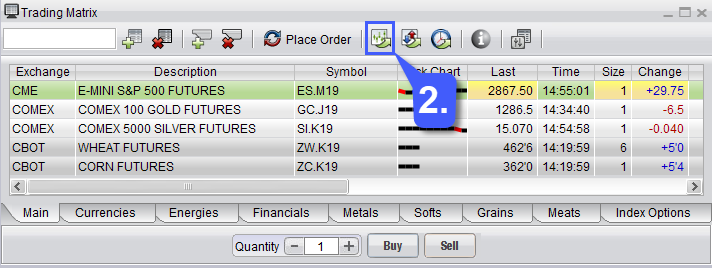
2. Once a futures contract has been highlighted and turns green, left click the Chart Window button on the trading matrix. This will automatically open a chart window with the highlighted contract and default chart settings applied to it.
Users also have the option of opening a chart from scratch, manually applying settings and the future contract they’d like to trade through the New Chart Tab window.
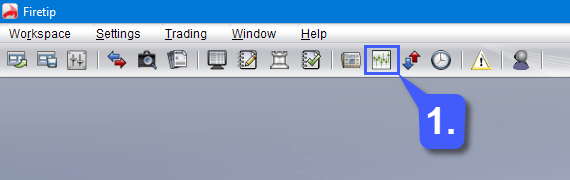
1. This can be done by clicking the Chart button along the toolbar at the top of the platform window.
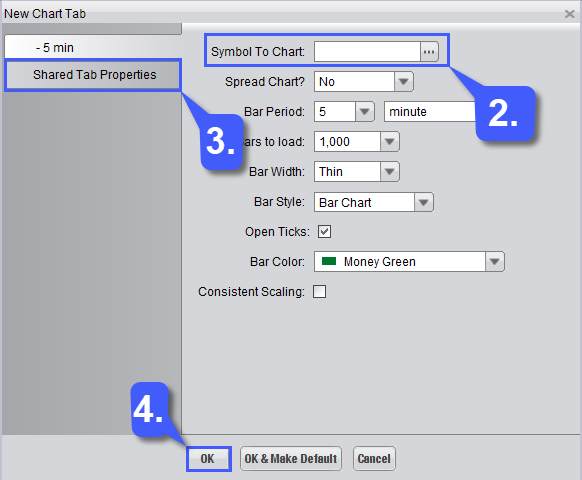
2. Within the New Chart Tab window, users will first need to select a futures trading contract, this can be done by manually entering the exact symbol in the Symbol To Chart field or by clicking the Symbol Finder button (three horizontal dots).
3. Once a contract has been selected, users can configure the chart settings that they see fit within the available settings. Users also have the option of customizing chart colors by selecting the Shared Tab Properties button.
4. Once the chart has been configured as seen fit by the user, left click the OK to open the chart with the applied settings.