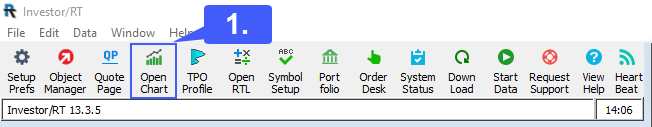
1. Navigate to the top left of the platform window. On the toolbar left click the Open Chart button.
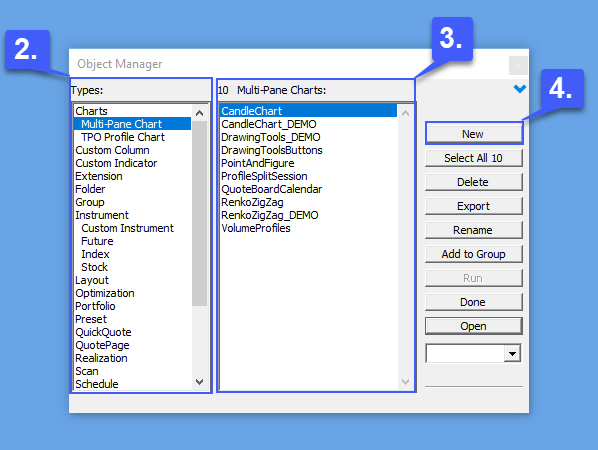
2. In the Object Manager window select the chart type you wish to open.
3. Next, under the Multi-Pane Charts section select the chart type you wish to open as well. In our example, we will open a Candle Chart.
4. Once a chart type and style have been selected, left click the New button.
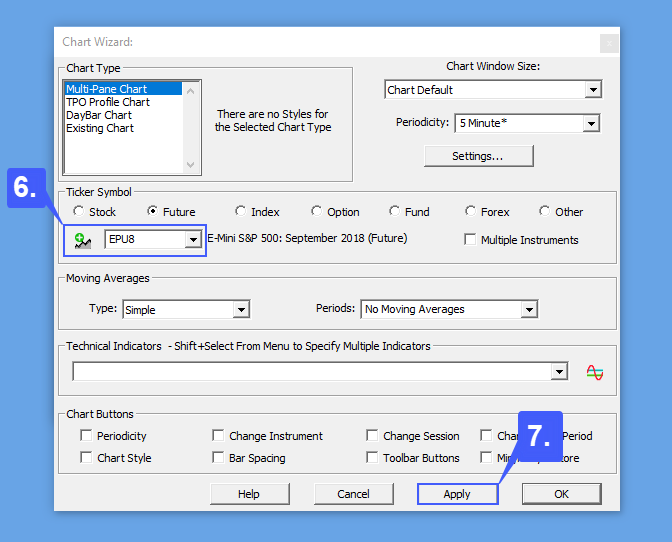
5. Adjust the settings in the Chart Wizard window to your liking. Users can specify the chart window size, time interval, ticker symbol, contract, moving averages, technical indicators, and many more options.
6. Manually enter the contract symbol in the dropdown box or left click the green + button to search for a contract to apply to the chart.
7. Once all settings have been entered and selected appropriately, left click the Apply button to apply the settings and open the chart.
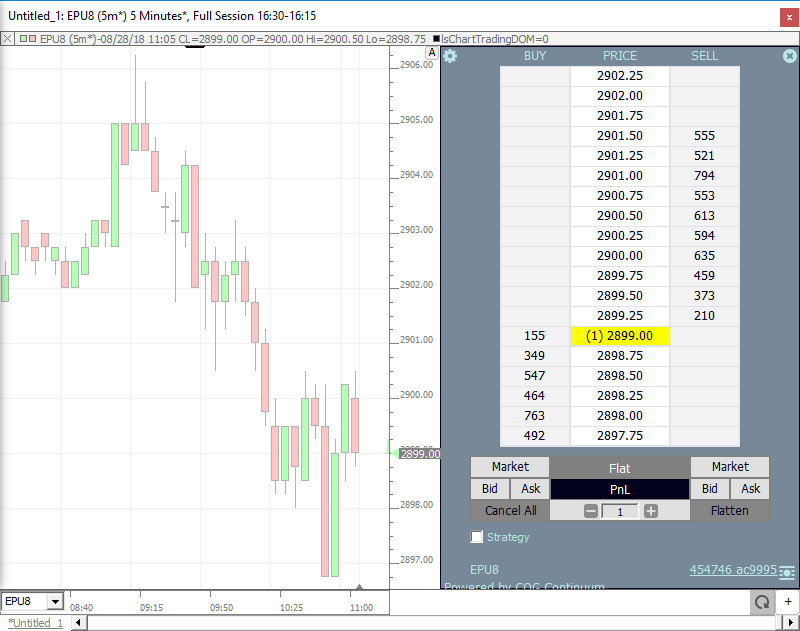
8. Once a chart is open right click anywhere within the chart.
9. In the context menu, left click the Trade…option.
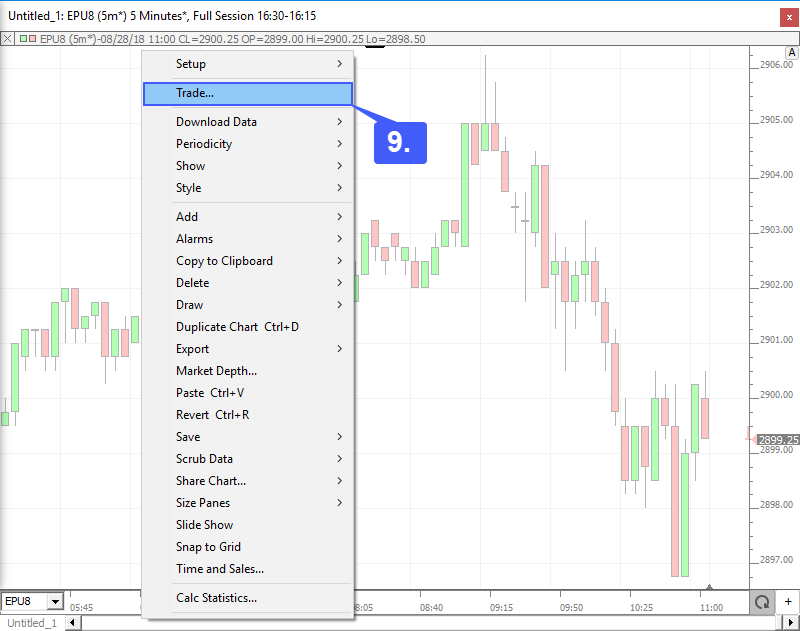
Doing so will open a trading dom located to the right of the chart.