To change the time interval of a chart users will first need to open a chart.
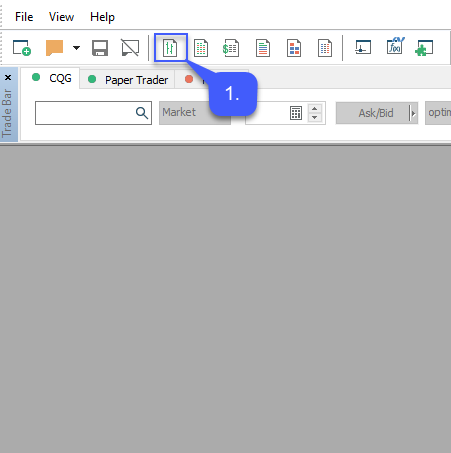
1. Navigate to the toolbar that runs along the top of the platform window. Left click the Create New Chart Window which is circled below.
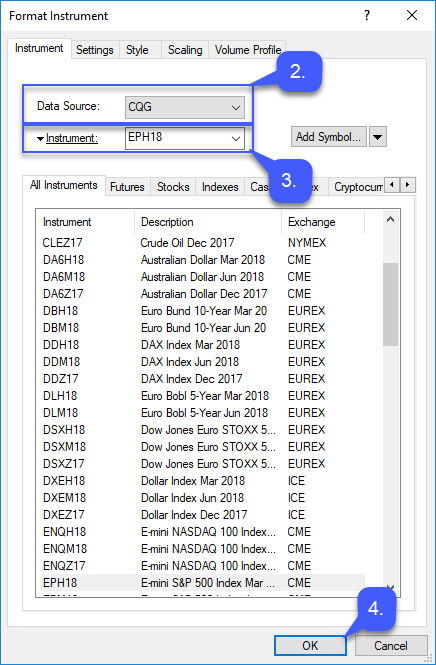
Once the Create New Chart Window has been selected and opened:
2. Users will need to specify the Data Source they wish to gather data from.
3. The Instrument or contract they wish to trade.
4. Once all of the following has been applied left click the OK button.
After the user selects OK, a chart with the corresponding symbol will open.
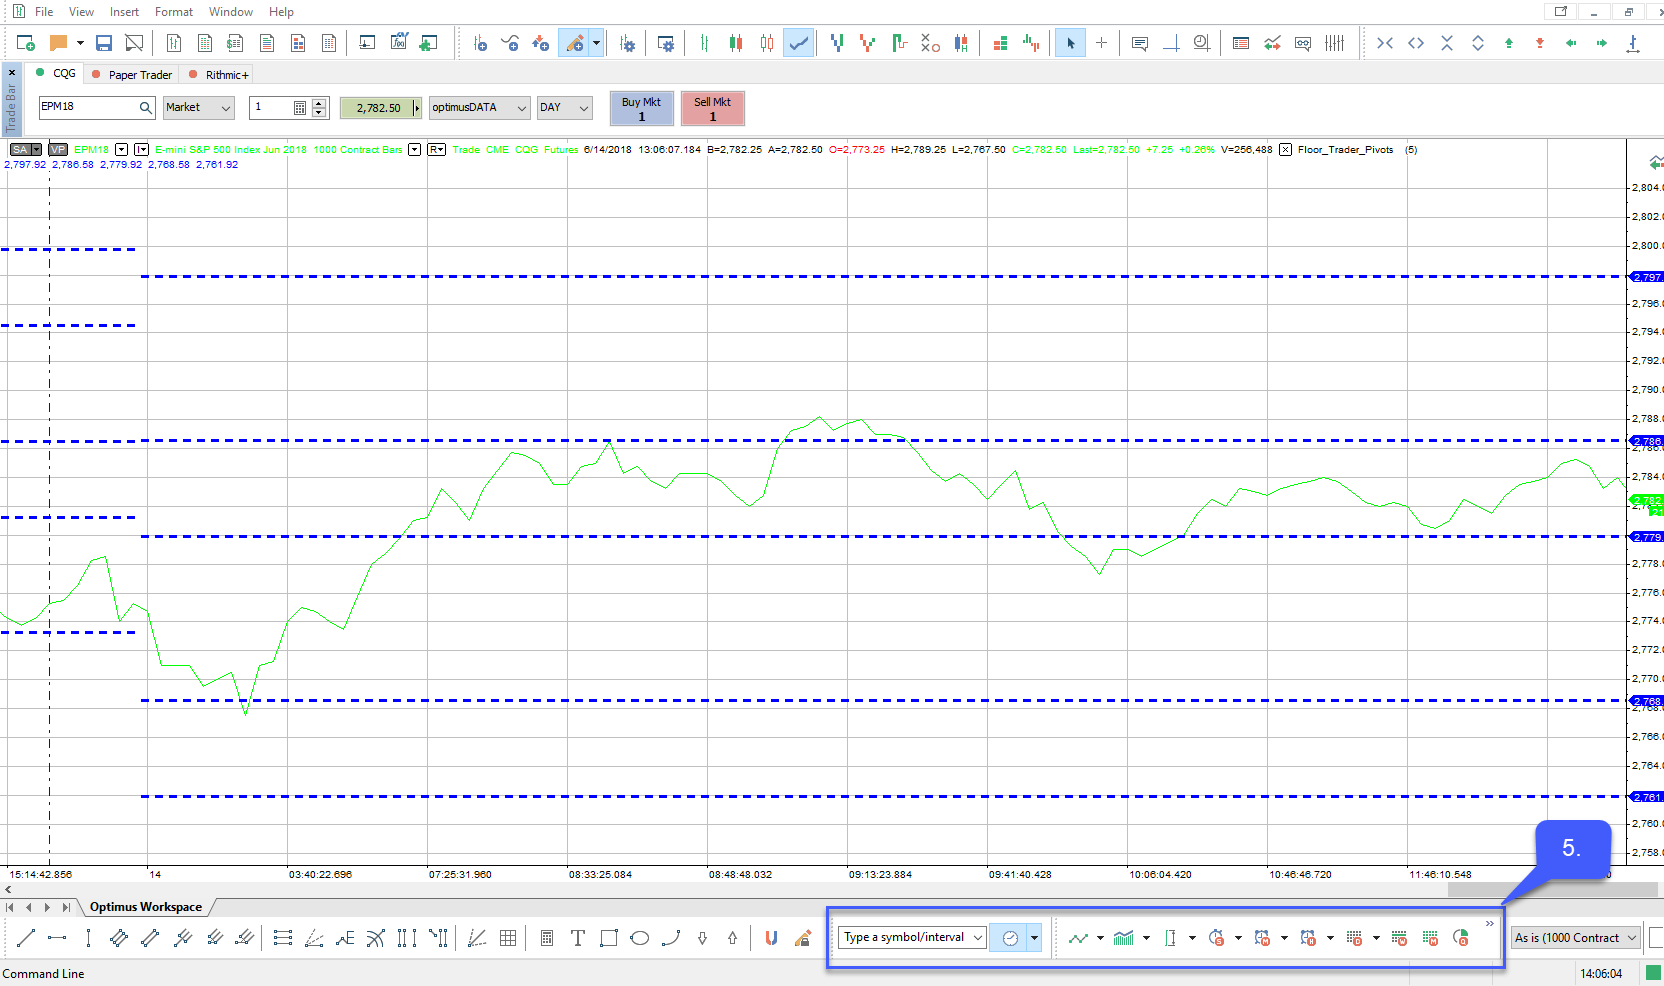
5. Now that a chart is open, the toolbar located on the bottom of the platform will now become available. Located on the right hand side are multiple buttons associated with adjusting the time interval. Select one of the following buttons to alter the X axis time interval of a chart.