To change the style or type of chart the user is working with, they will first need to open a chart.
1. After a chart has been opened, users have one of two options to change their chart type.
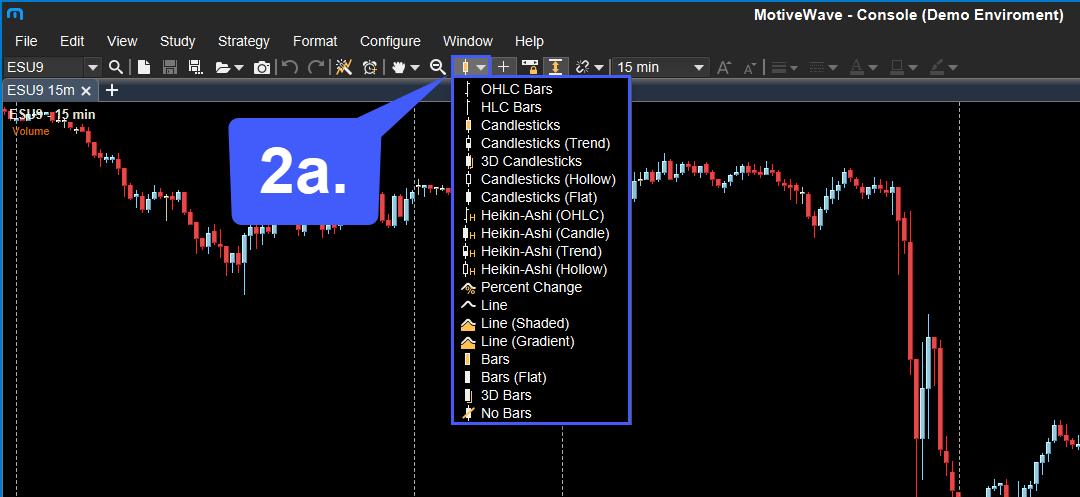
2a. Left click the chart type icon located above your chart. With the dropdown menu open, left click the chart type you would like to configure your chart with, once selected, your chart will automatically reconfigure itself to the new chart type you have selected.
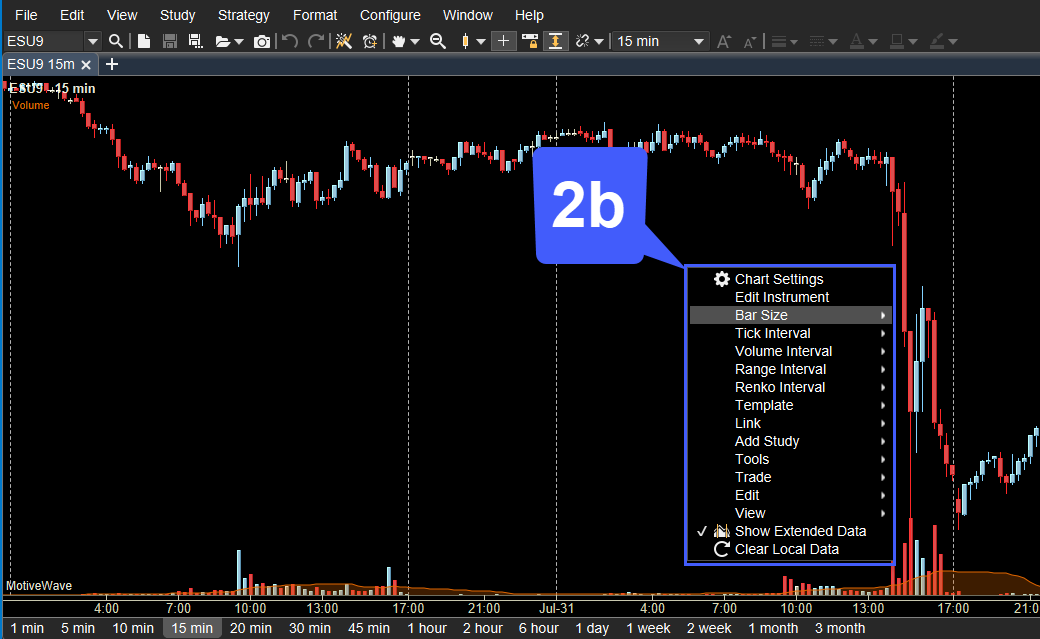
2b. Users also have the option of right-clicking directly within the chart window. Right-clicking within the chart window will open a context menu. Within this context menu users can select their chart type, bar size, tick interval, add studies, trade, and much more.